This is first post of a new series Exploring ABAP Debugger where I will talk about ABAP debugger features and try to compare them with Eclipse wherever possible.
I personally like the GUI ABAP debugger a lot and prefer it over Eclipse Debugger and I hope that Eclipse Debugger will get better with time.
In this post, you will learn about saving a debug session and loading the saved session. This feature is only available in GUI ABAP debugger and not in Eclipse Debugger.
1. Consider that you have set up multiple break-points.

2. Use the menu option Debugger > Debugger Session > Save .
A pop up screen ‘Save Current Debug Session’ appears. Here, select the checkbox for breakpoints and provide new name in session name.

You can also save Watchpoints, debugger settings and Layout etc as well.
3. Take a break. Log out, log in again.
4. Load the session using Debugger > Debugging Session > Load .
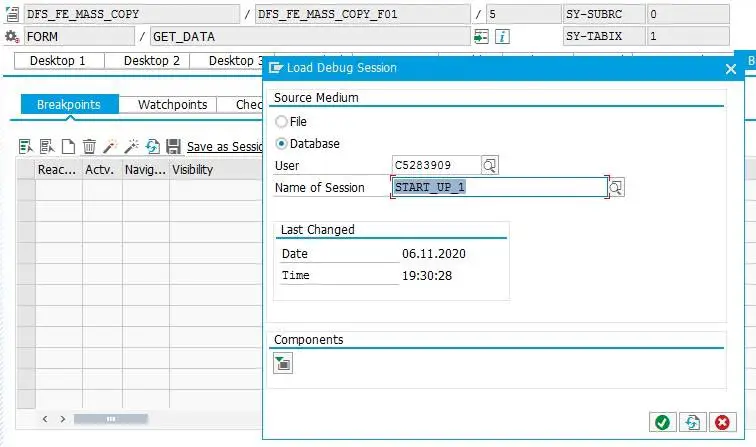
Note that you can also save the session to a file instead of database.
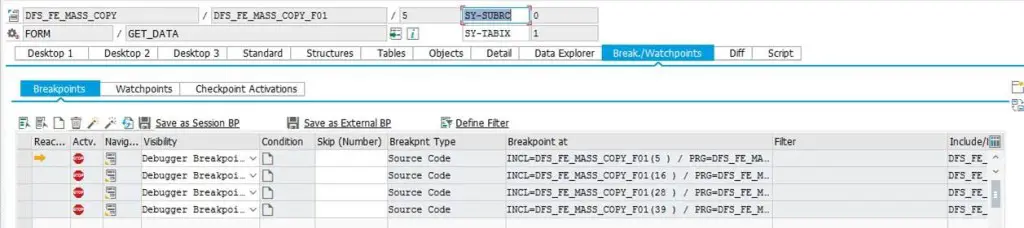
5. The breakpoints are loaded.
This is not a very popular feature and I have found that very few ABAP developers are aware of this. Do let me know in the comments whether you were aware of this and whether you find this useful.
Visit ABAP Debugger page to see more articles on debugging.
If you like the content, please subscribe…

Correctly said. It’s seem to be very useful but hardly anyone aware of including me. Will try next time
LikeLike
Take a break. Log out, log in again.
This part can you please elaborate. Can we logoff the entire sap client and then login and load the same?
LikeLike
Hi SB
Yes. This means that once you save the session, you can log out from the system. When you log in again, the debugger session can be loaded and you will have all your break-points placed again.
LikeLike
I was not aware of this feature
It is very useful
Thank you for sharing
LikeLike
I am not gettng the popup to save session breakpoint
LikeLike