This series covers all the details about ABAP debugging.
There are 3 debug options available.
- Classic Debugger
- New ABAP Debugger
- Debugging in Eclipse
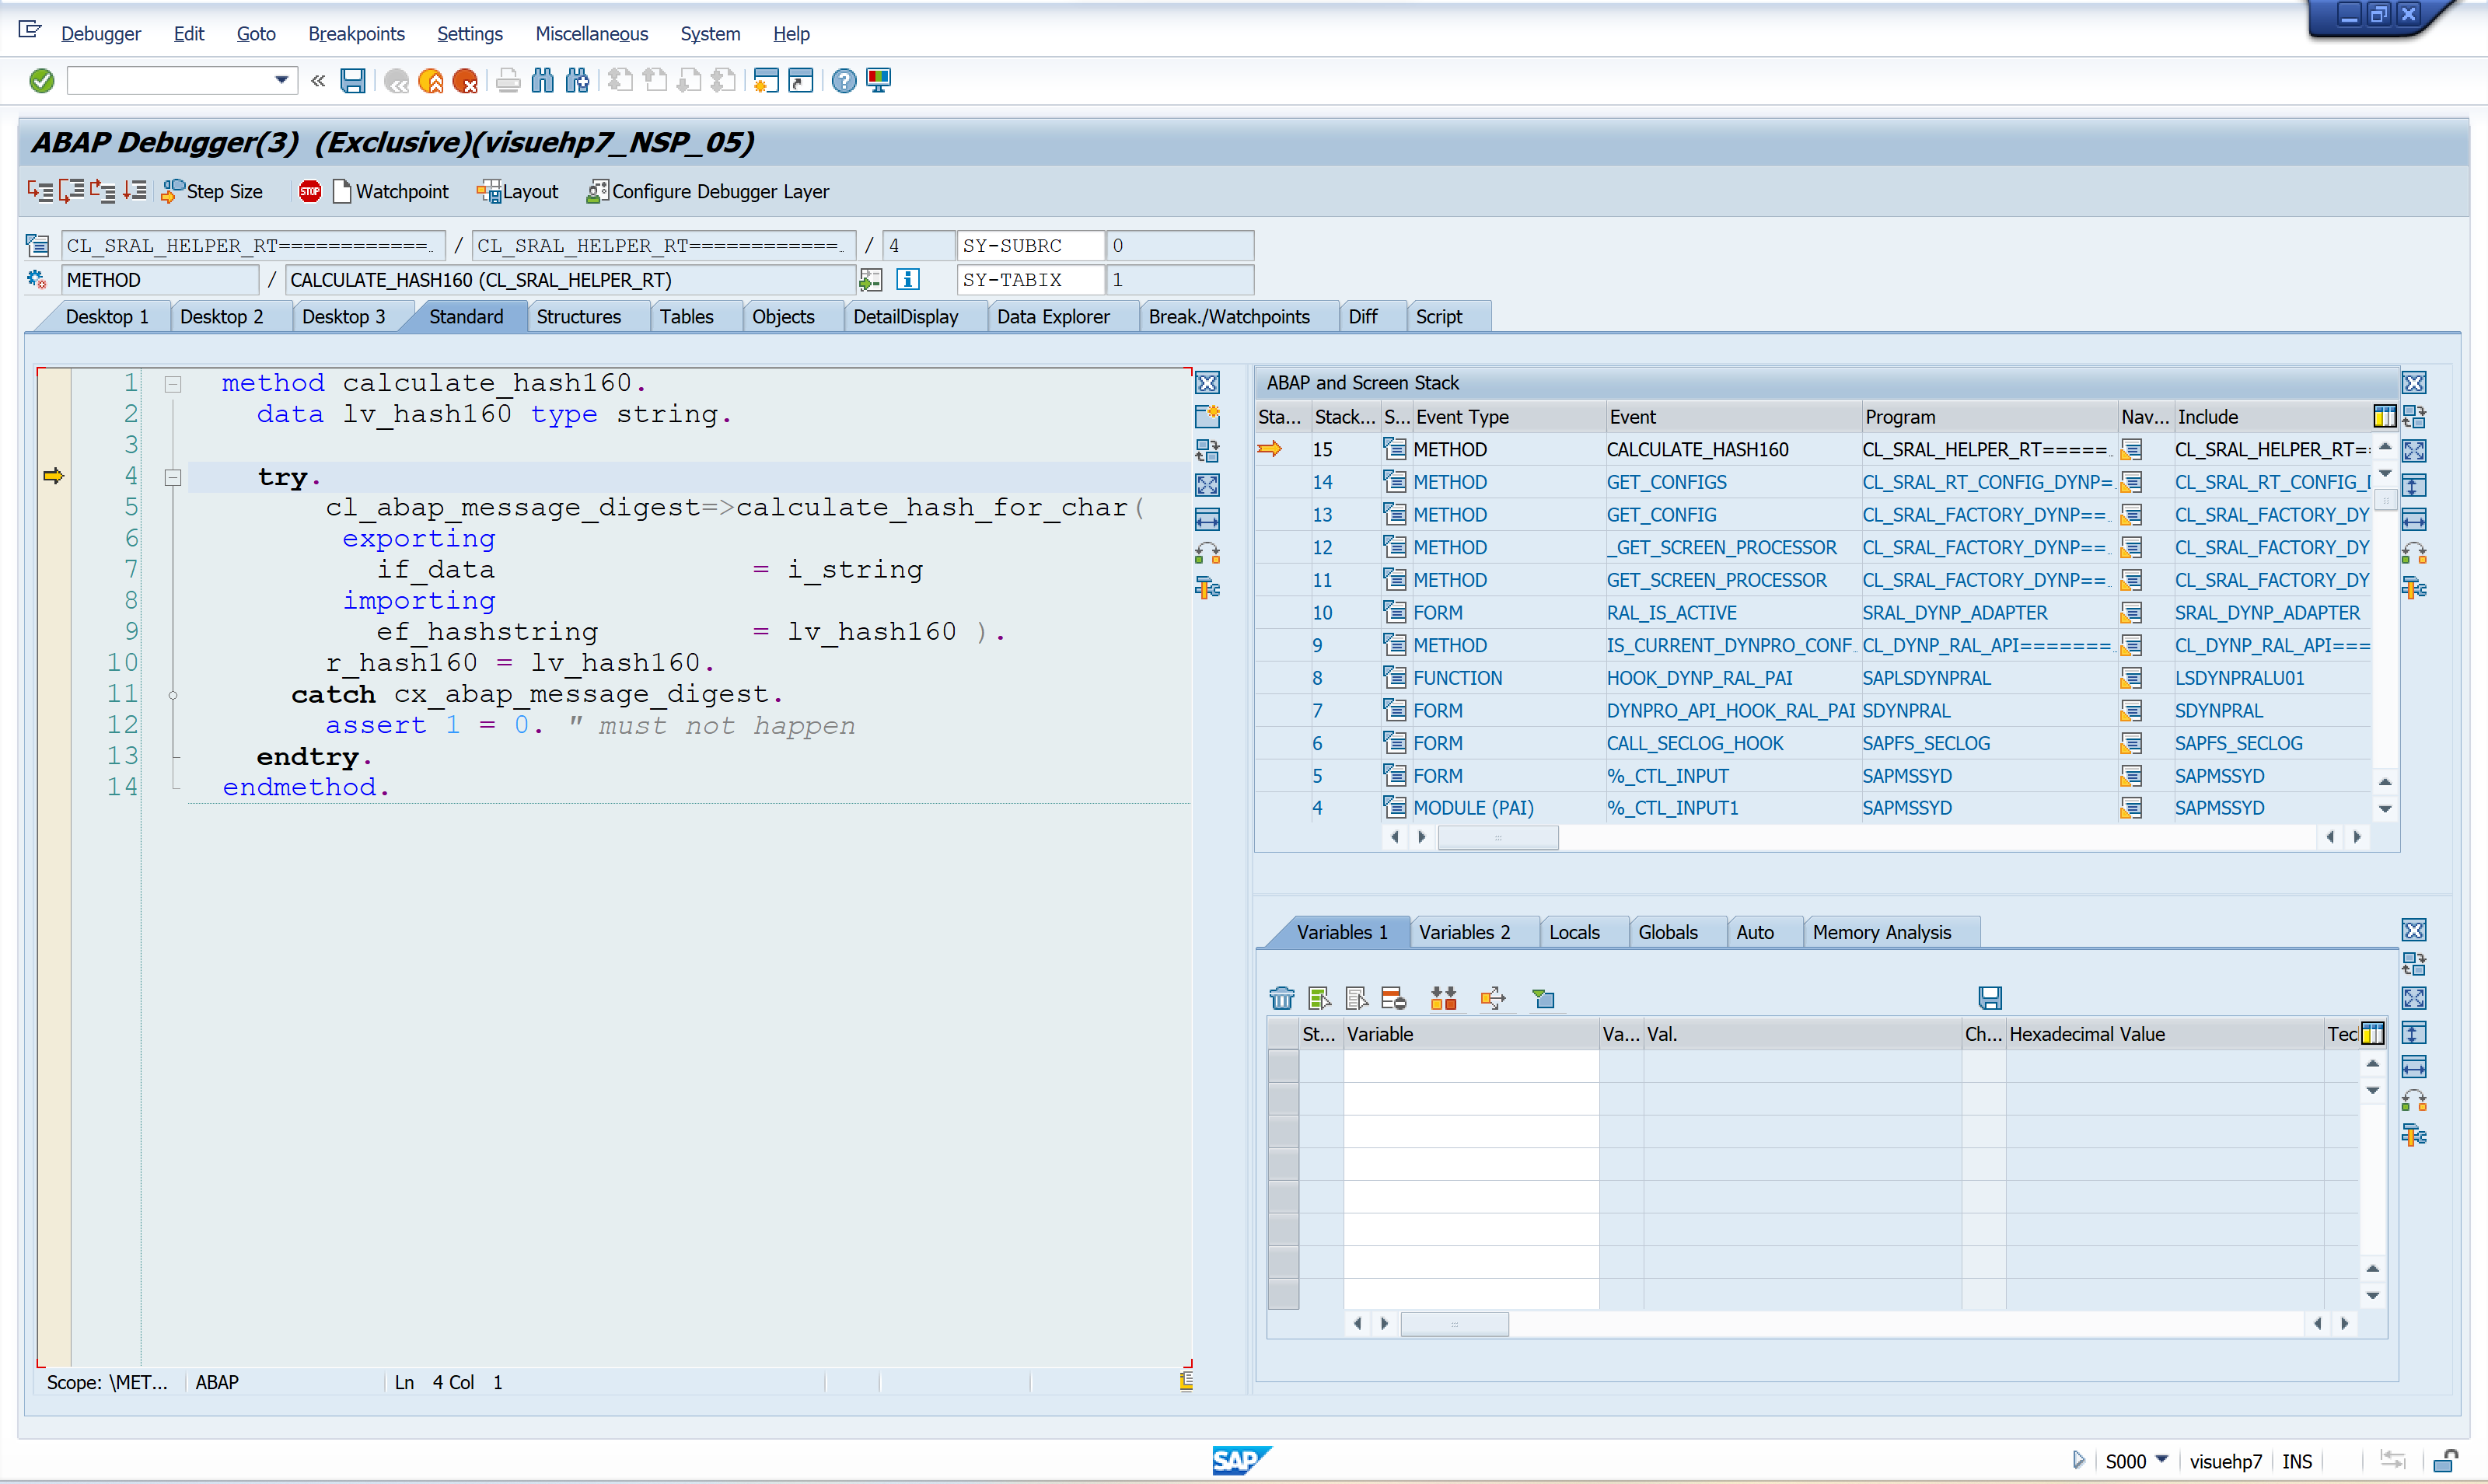
This post is based on debugging done in New ABAP Debugger.
The main differences between the Classic and the New ABAP Debugger are described below. Most of these can be also mentioned as advantages of the New ABAP debugger over the Classic Debugger.
- The new Debugger is displayed in its own window of the SAP GUI, the classic ABAP Debugger is displayed in the same window as the application.
- The user interface of the new Debugger can be configured as required so the user can design the user interface to suit his requirements. This is not possible in the Classic debugger
- The new Debugger has more than eight desktops.
- Newer debugging techniques (such as Debugger Scripting, External Debugging, and Layer Aware Debugging) are only provided in the new ABAP Debugger.
- Conversion Exits can only be debugged in the new debugger.
Starting and ending the debug session
Debugger Settings
Go to transaction SE38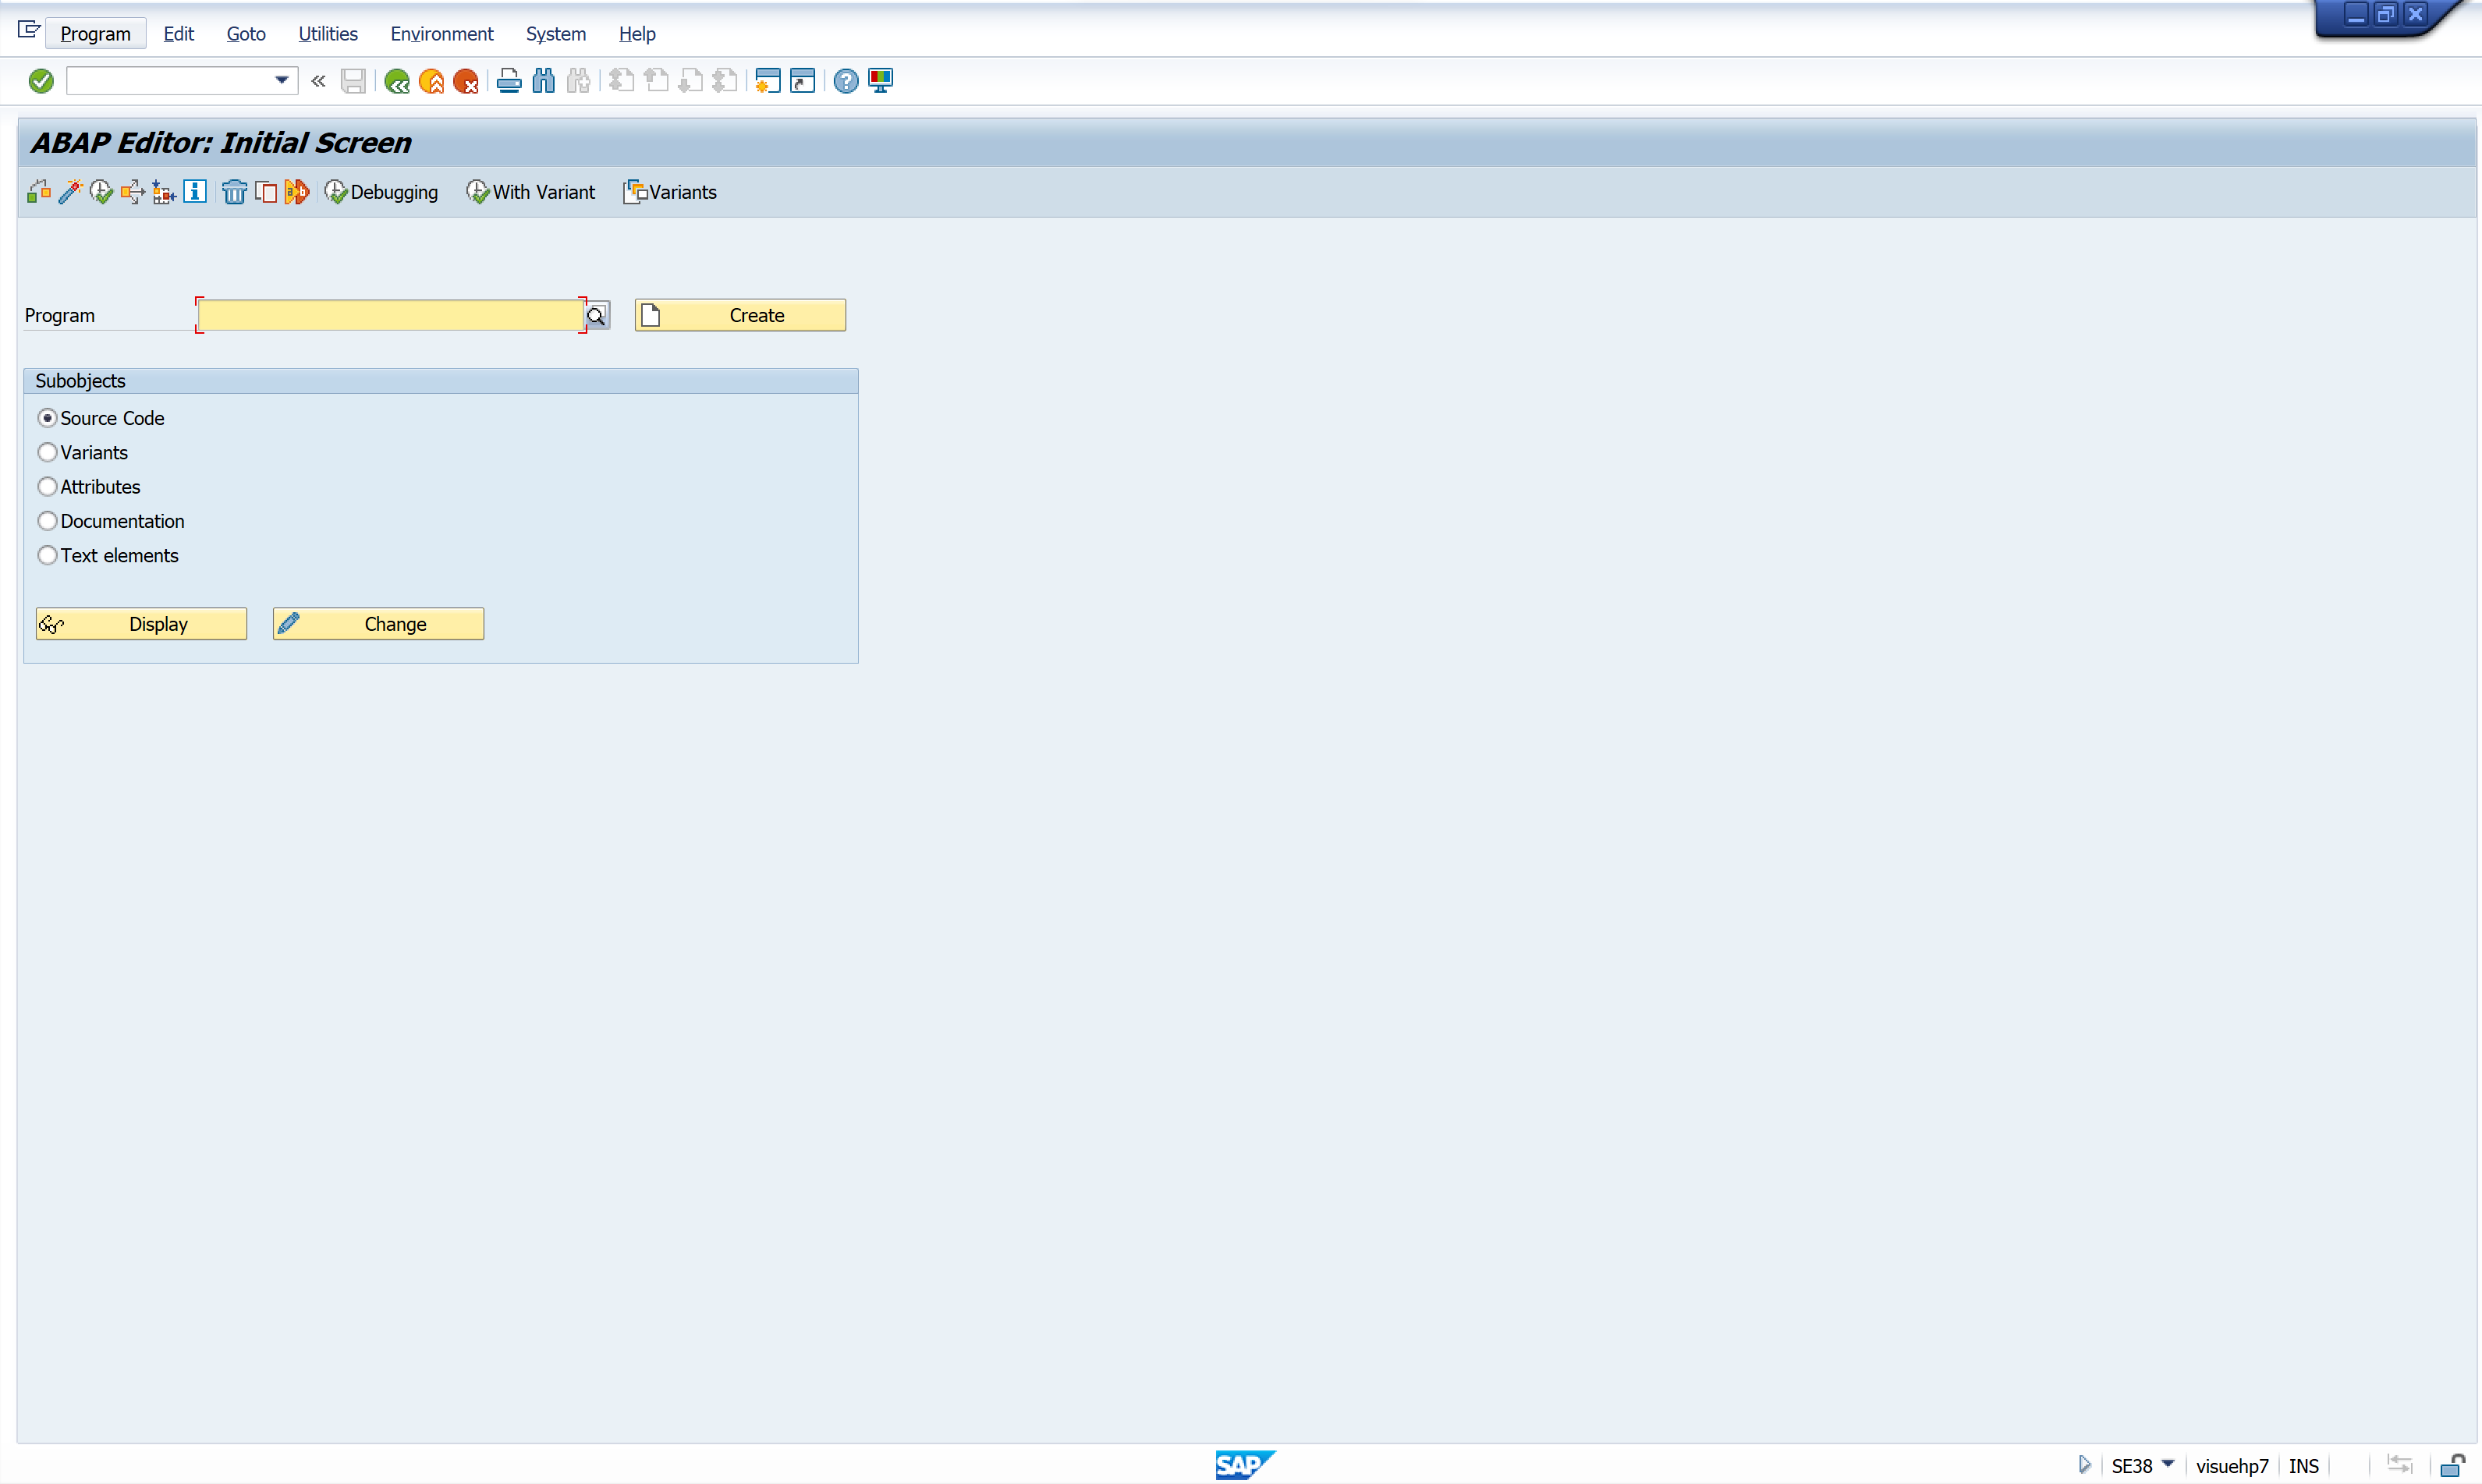
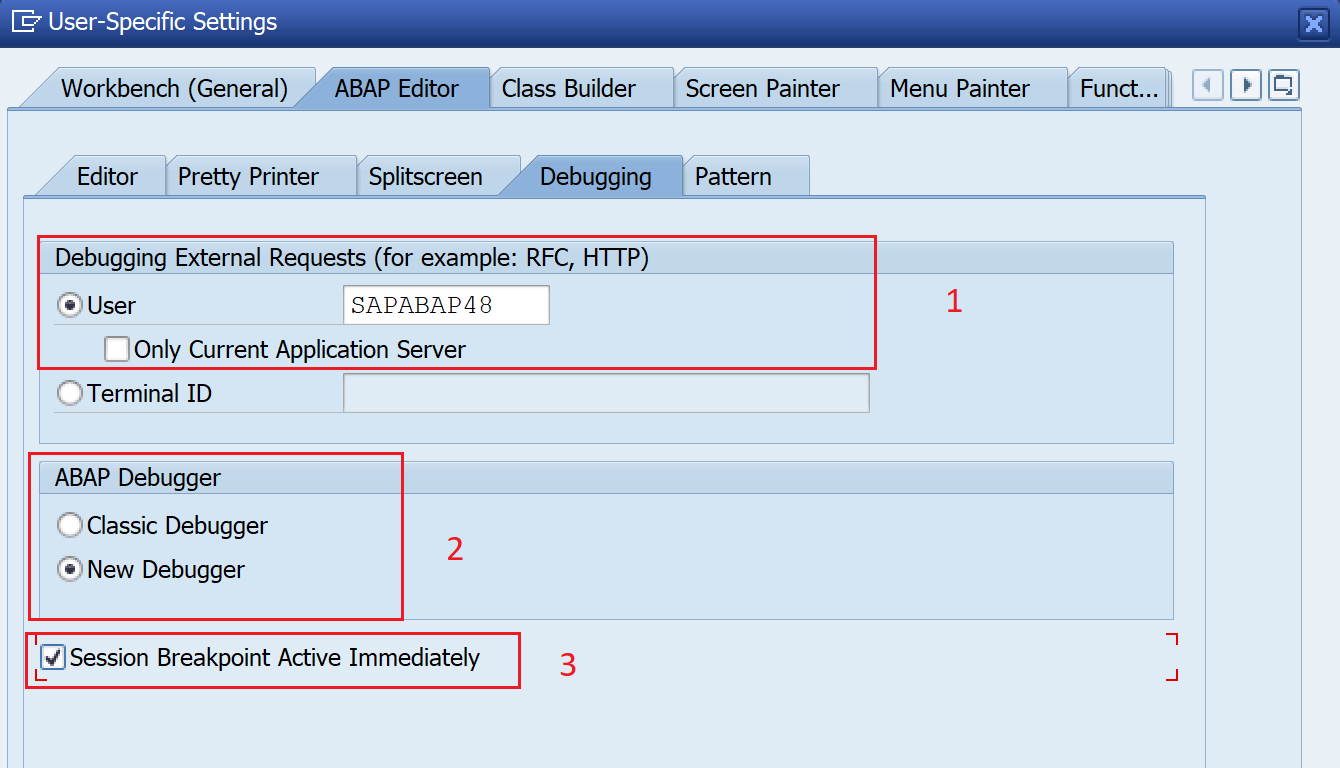
Follow the path Utilities > Settings > ABAP Editor > Debugging
Set up the below settings.
- User for external debugging – this setting can be used for debugging external requests with the same or different users.
- Choose New Debugger – this helps start the debug session in the New Debugger window
- Check the checkbox for Session Breakpoint Active Immediately – this activates the session break-points immediately
Debugging Authorization
There are various ways to start a debugger and the most is to input command /h. However, you need to have the authorization to start the debugger.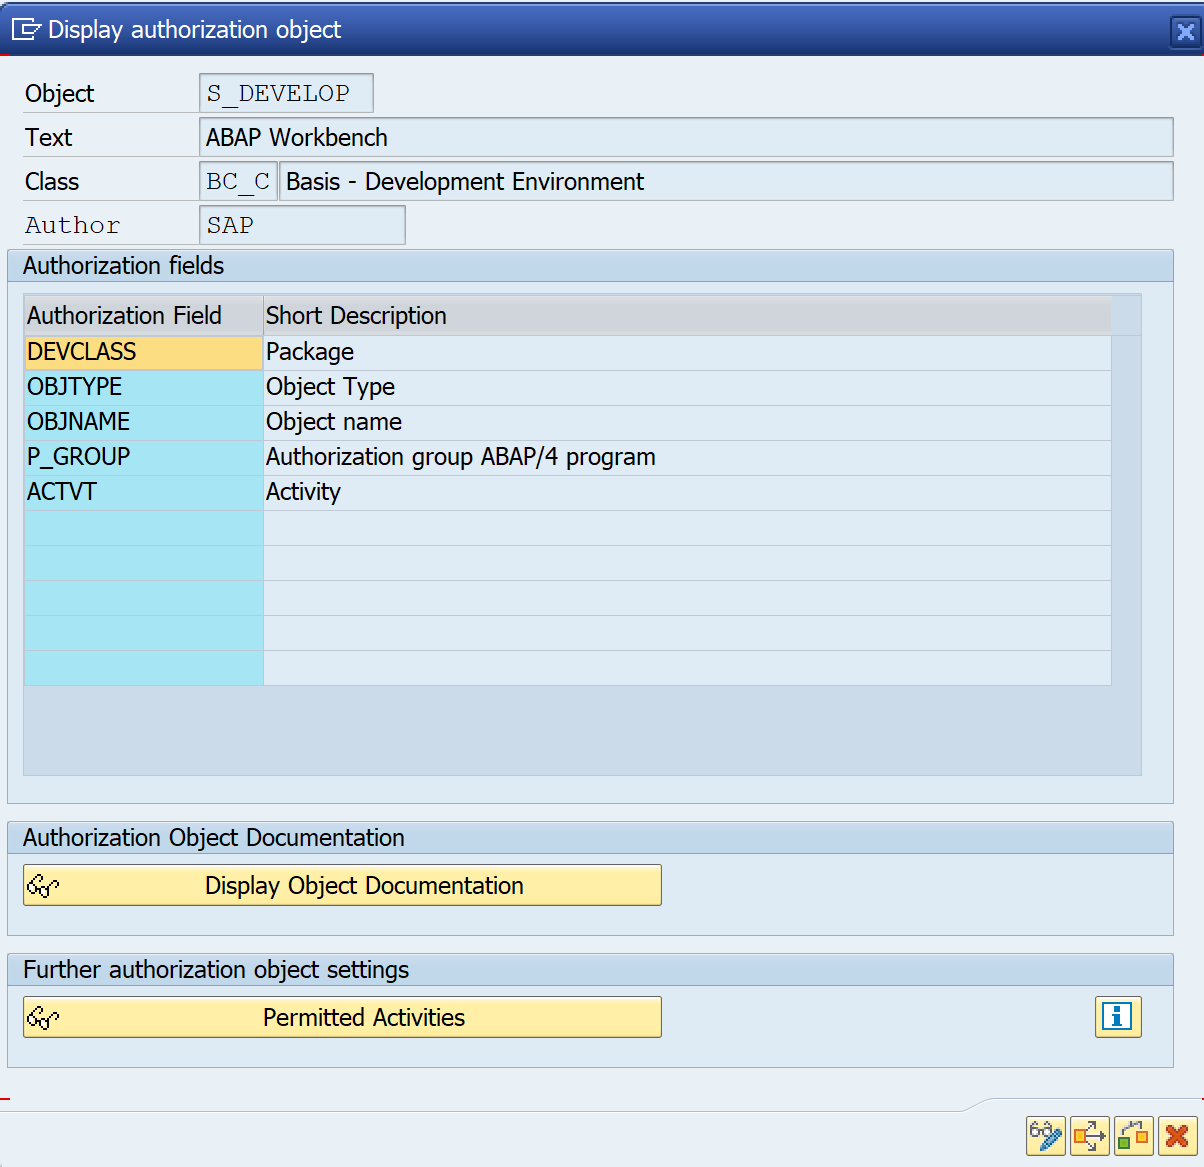
Object type: DEBUG and Activity 01, 02, 03 should be allowed for you to test out everything that is explained in this series.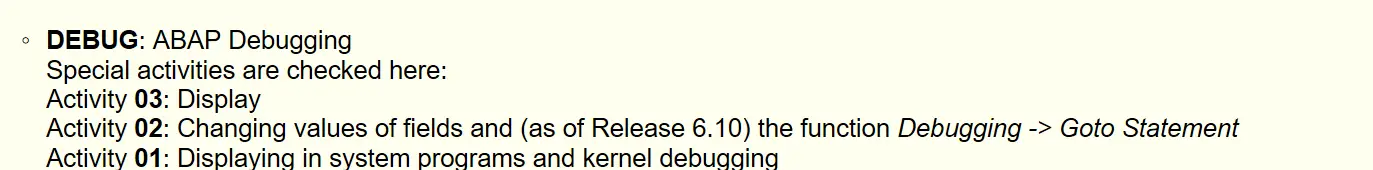
Starting the debugger with /h
On any screen enter /h in the command field and hit enter to switch the debugging on.
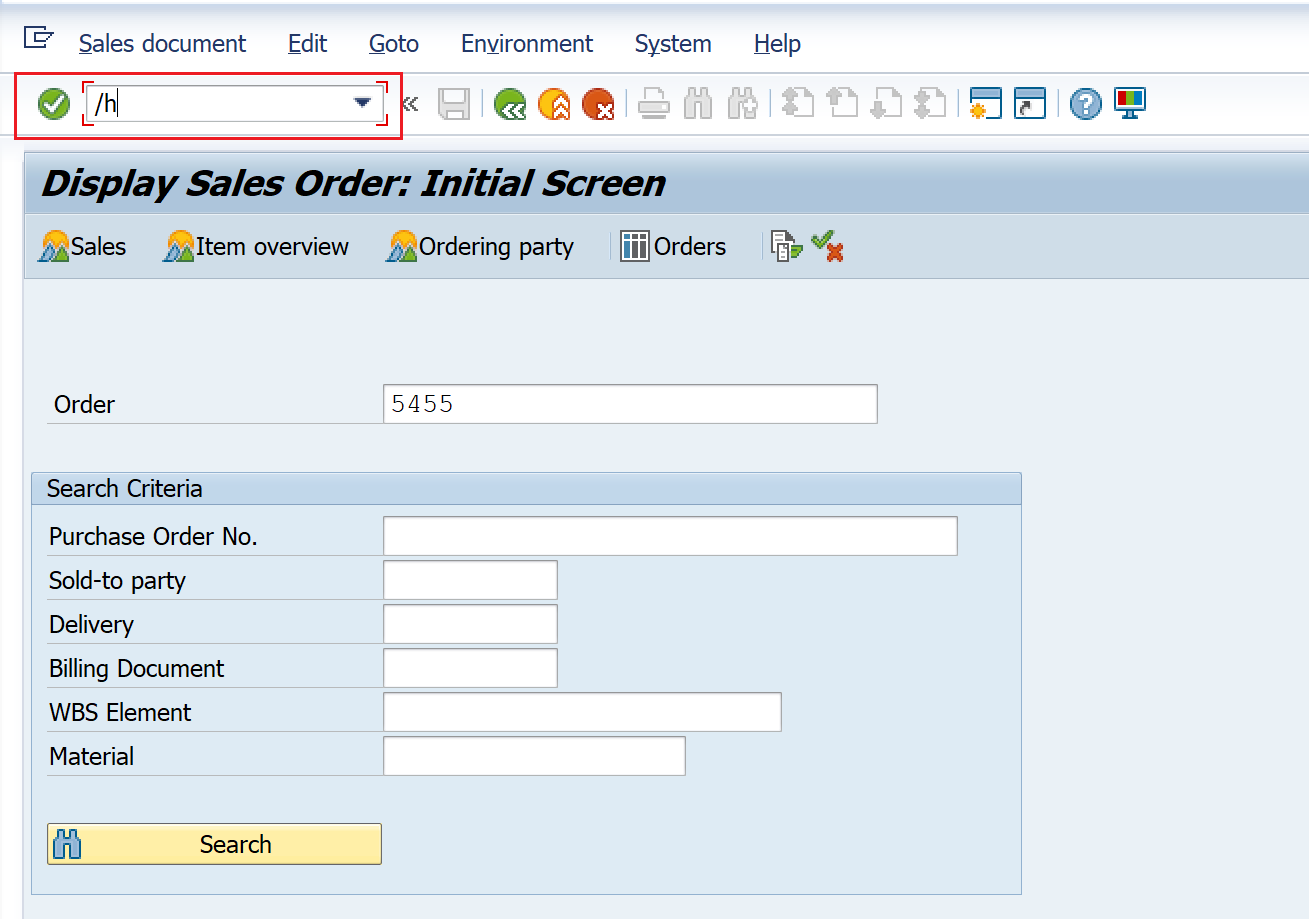
Once you enter, a success message ‘Debugging is switched on’ appears on the status bar.
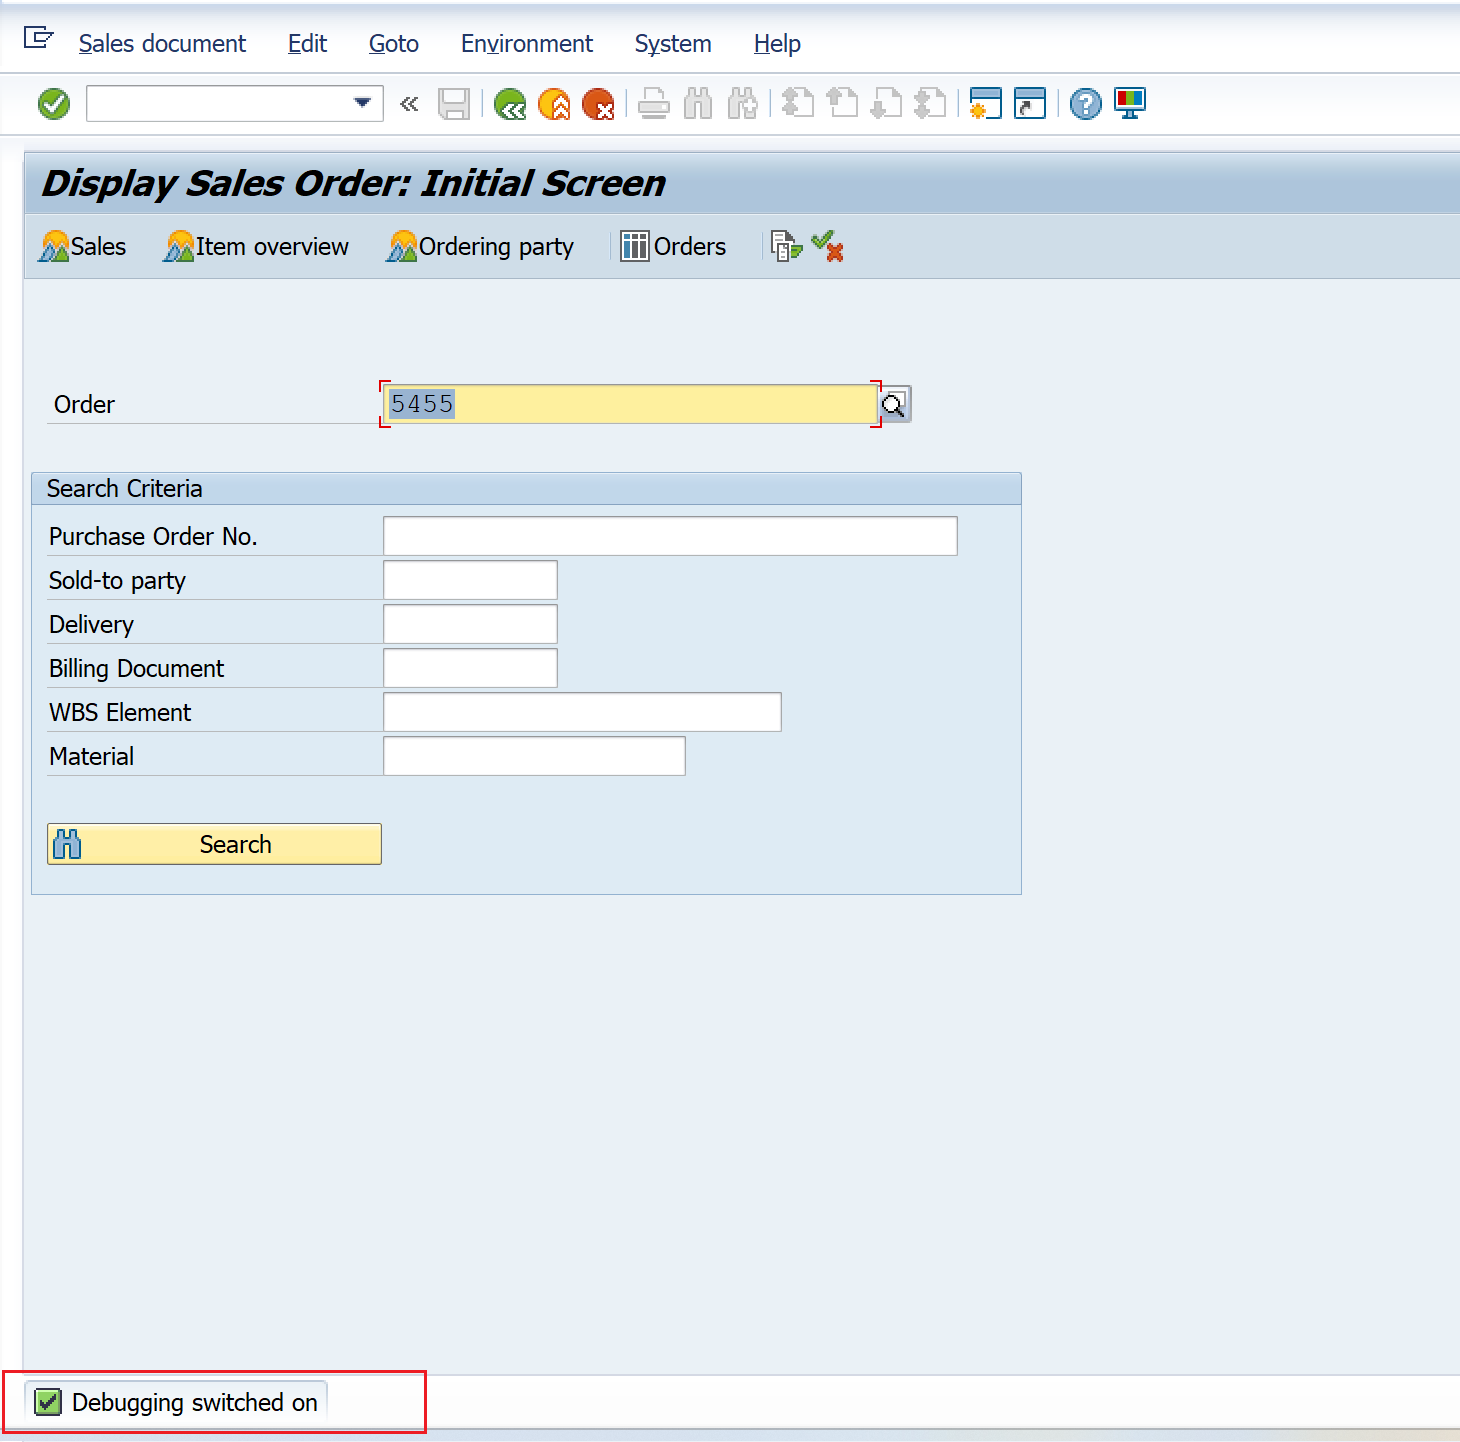
After this, if you press any button or a key that is an action on the current screen, the debug window will open.
Starting the debugger using editor options
In SE38, enter the program name and use the application toolbar button to start the execution in debugging mode.
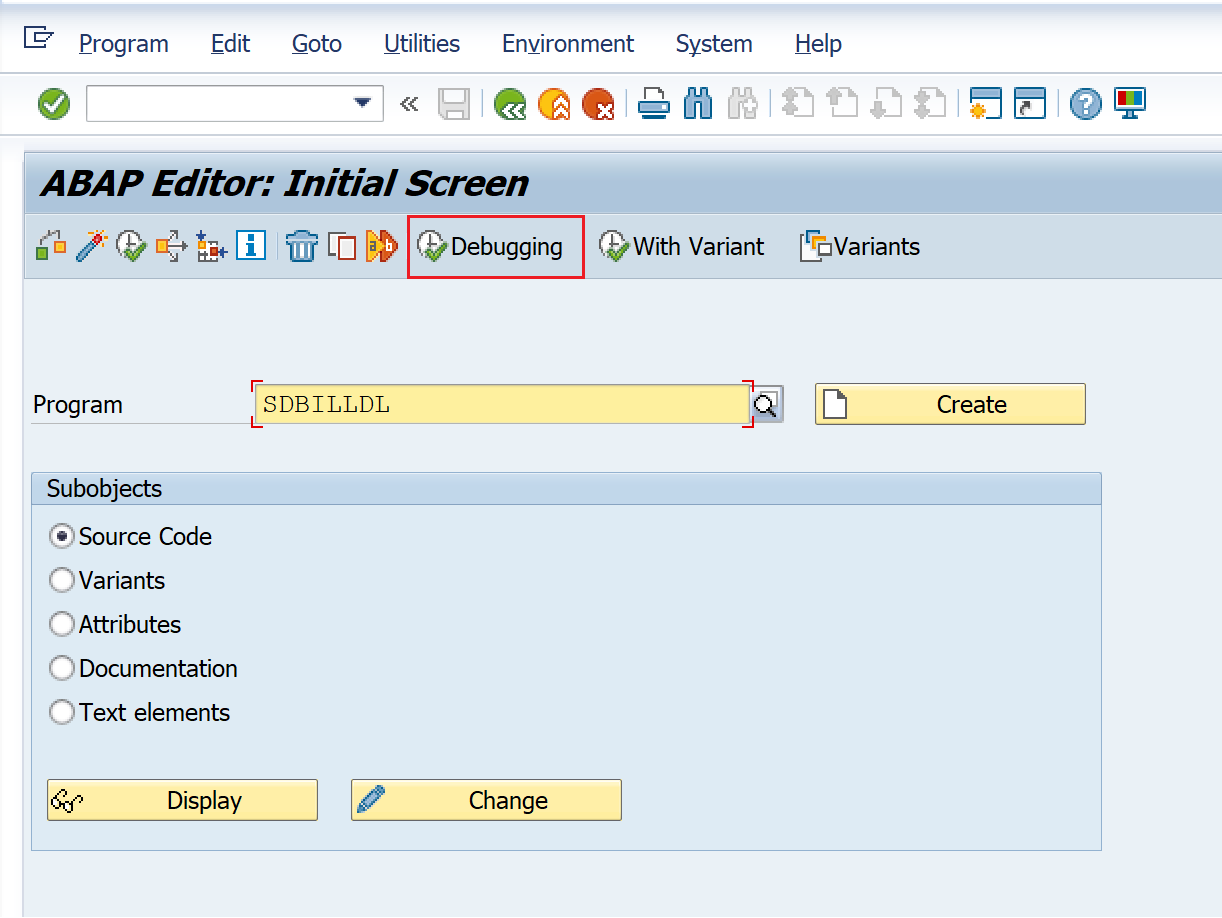
The debugger starts within the Initialization section of the program.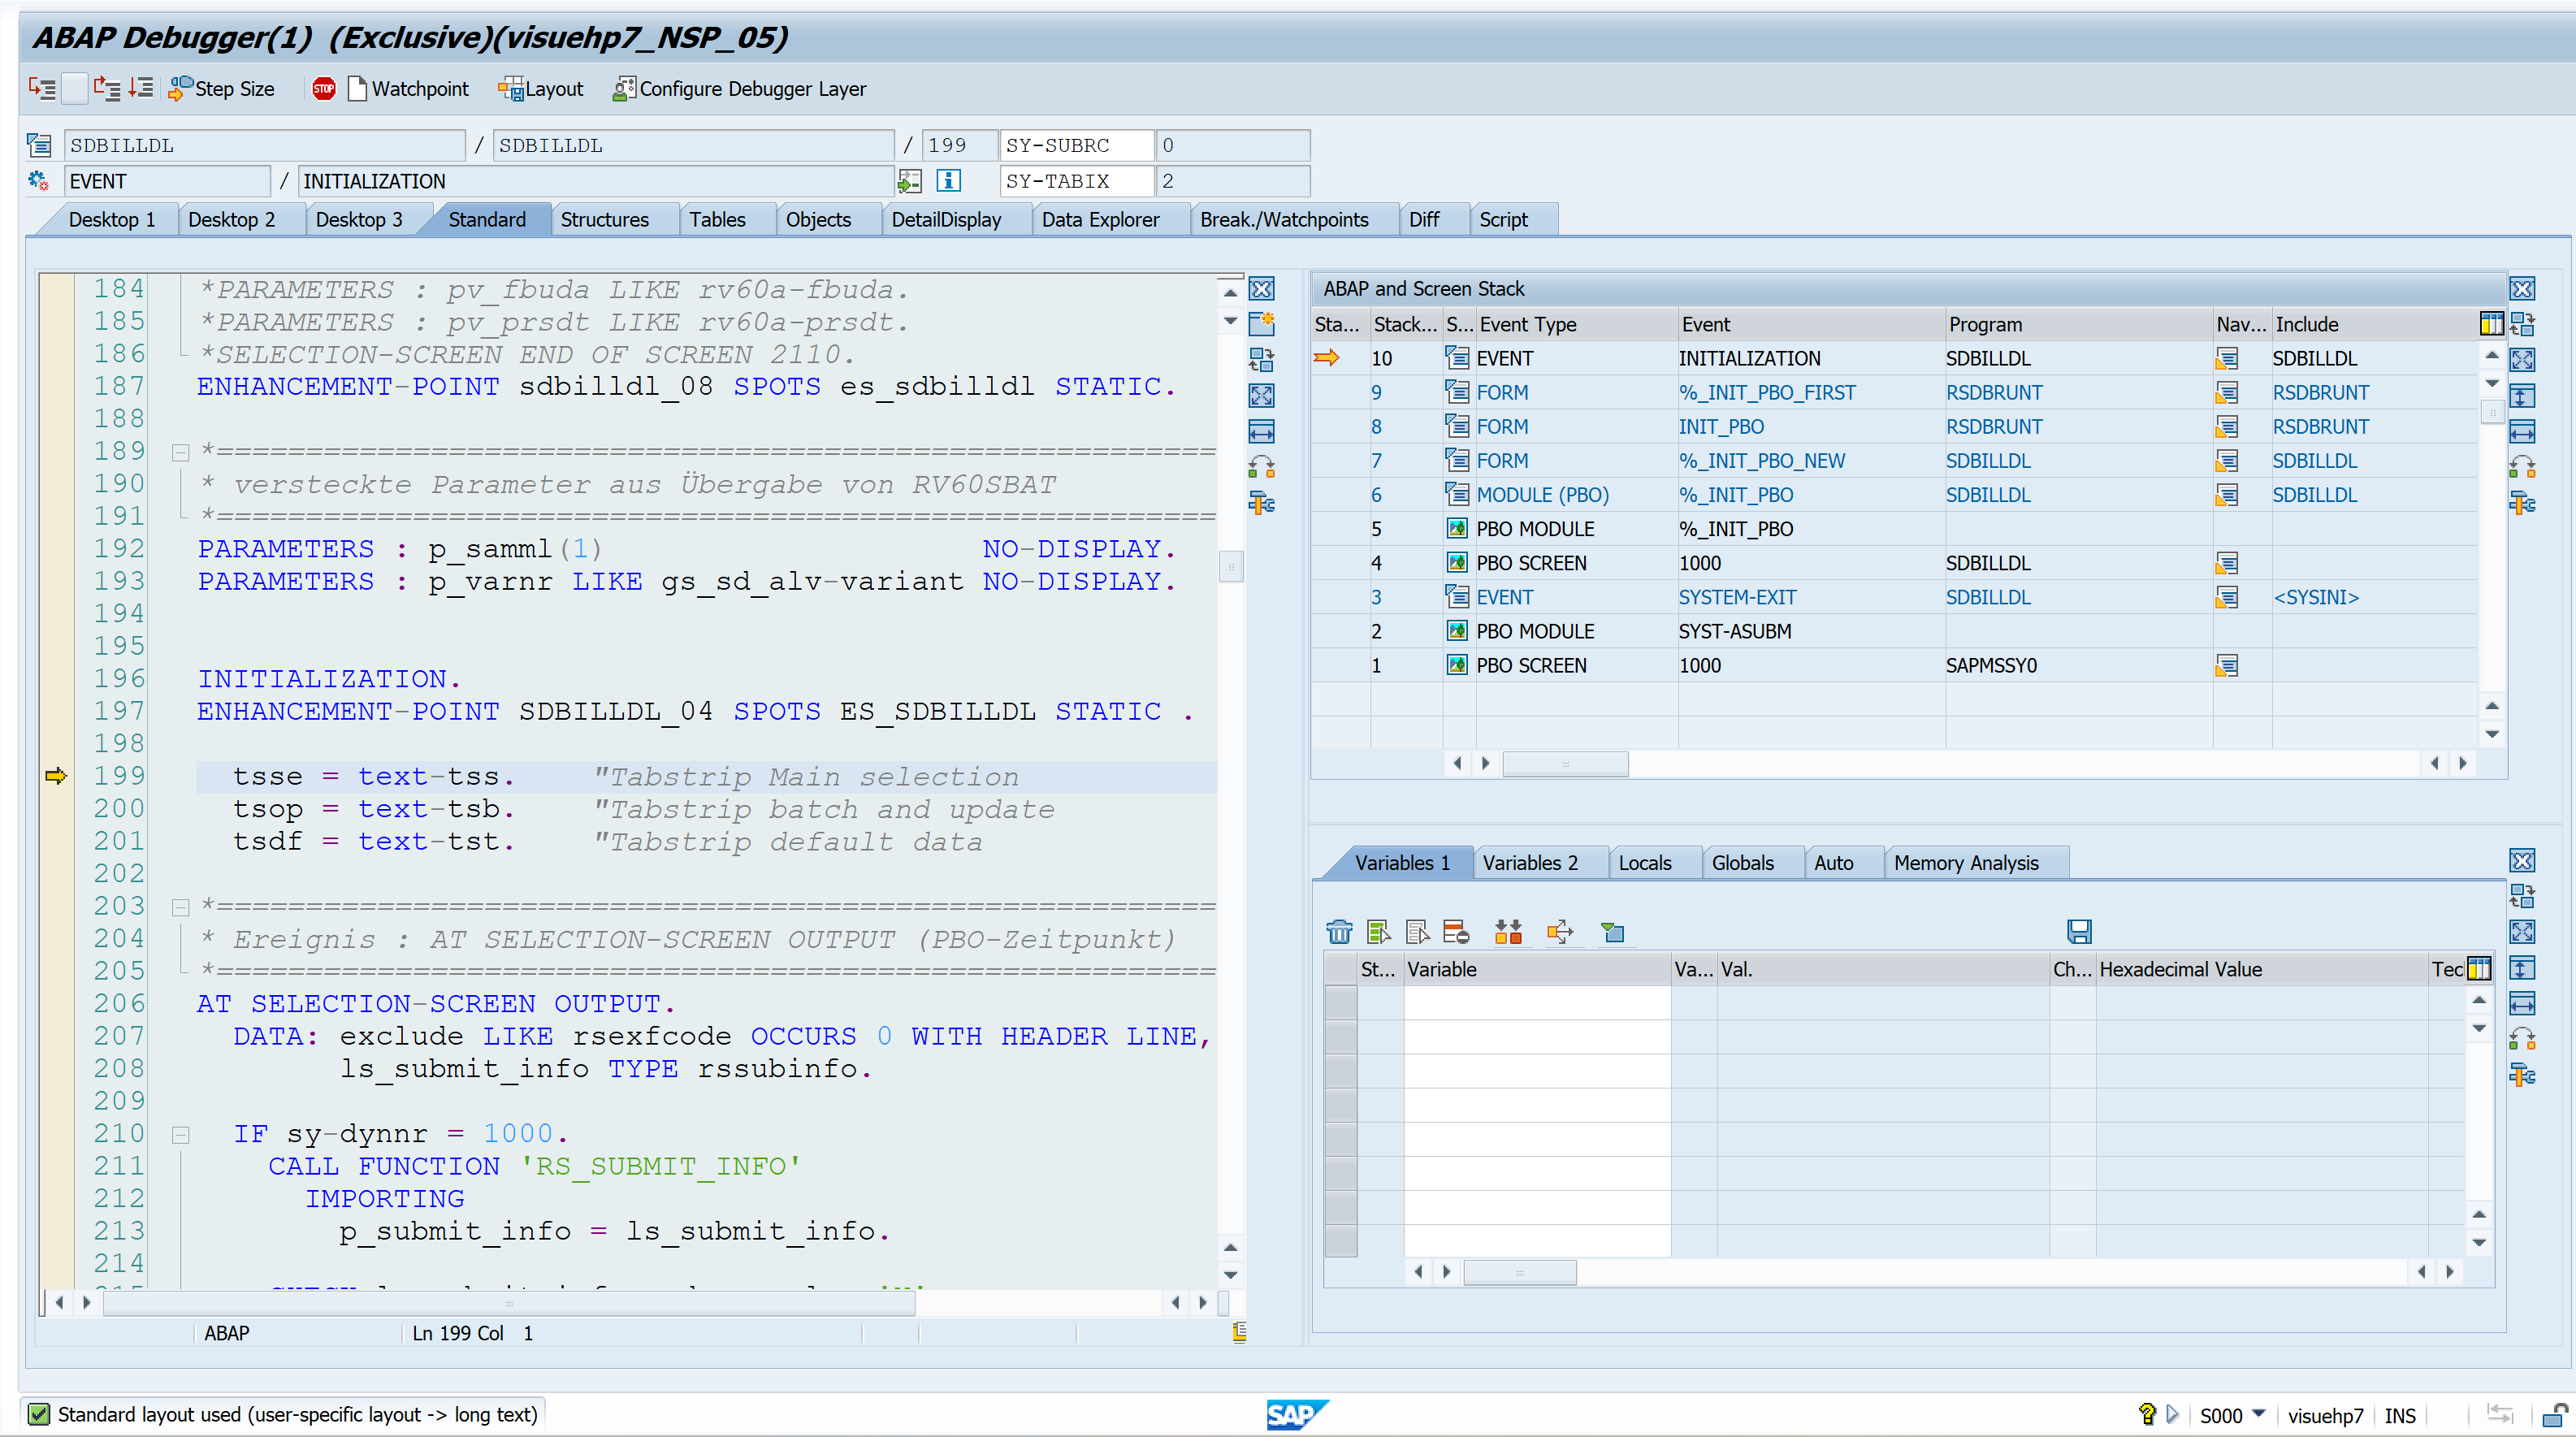
This option is only available for programs of type report and can not be used for Module Pool programs.
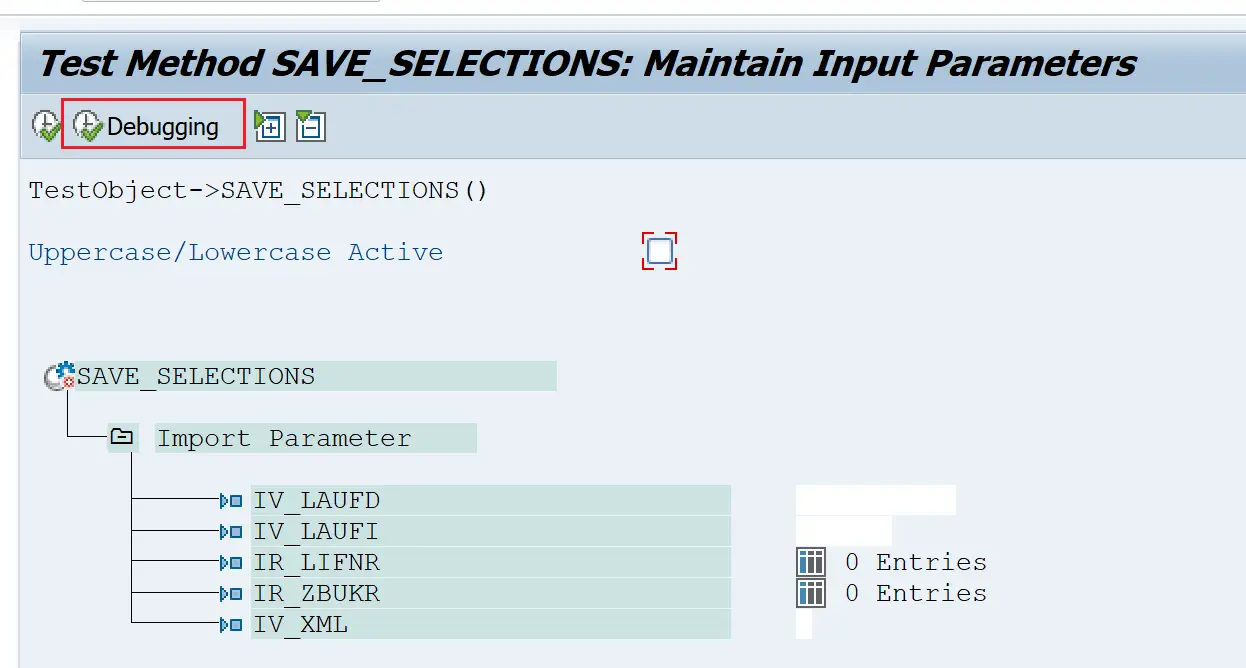
Similar functionality is available in SE37 for function modules and SE24 for method execution.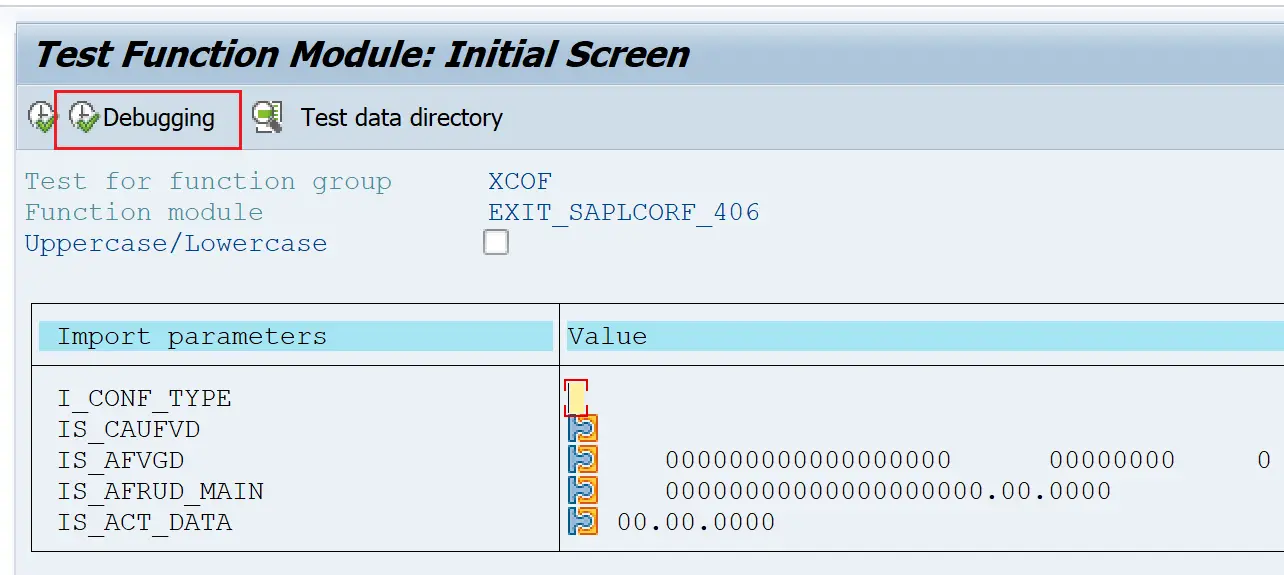
Starting the debugging using break-points
Even though it is possible to use any of the above 2 methods to start the debugging, it is not the most accurate way to debug as the starting point of the debugging is the first executable statement in the report, FM or method or after the point where /h is used.
A more effective way is to place a breakpoint in the code where we want to debug and start from there. This is only possible if we already have some understanding of the code to be debugged.
Let us understand break-points first.
Breakpoints interrupt the program execution and transfer the control to the ABAP Debugger.
Breakpoint Types
There are various types of breakpoints. The types are mentioned below and they may not be mutually exclusive and sometimes can be converted from one type to other.
- Session breakpoint
- icon used is

- can be triggered in the same user session where the breakpoint is set
- used to debug GUI based applications
- icon used is
To set a session breakpoint, click on the line in the editor and choose Utilities>Breakpoints>Set/Delete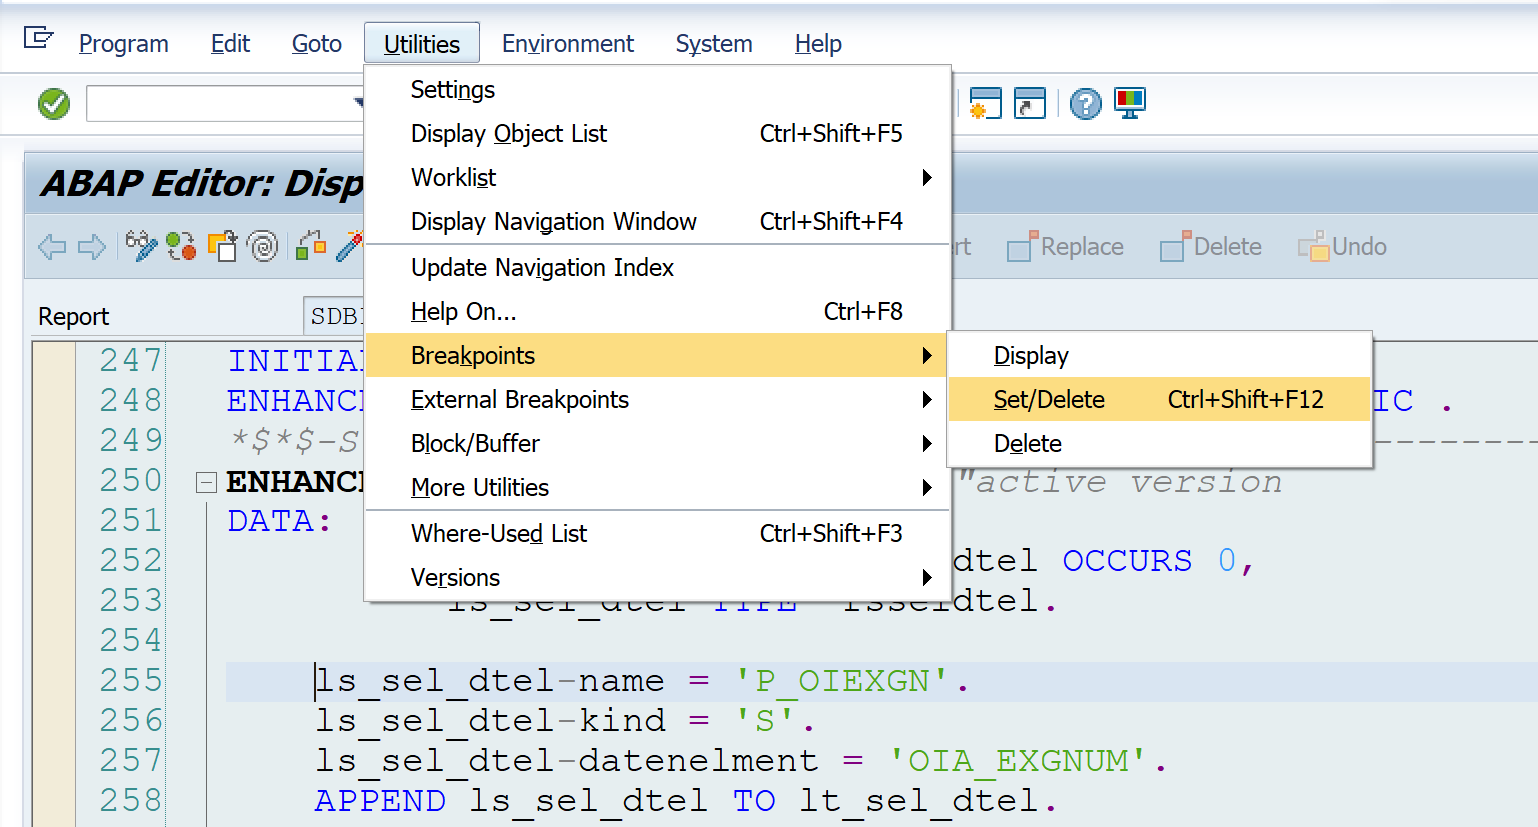
A better way to do the same is to use the application toolbar button.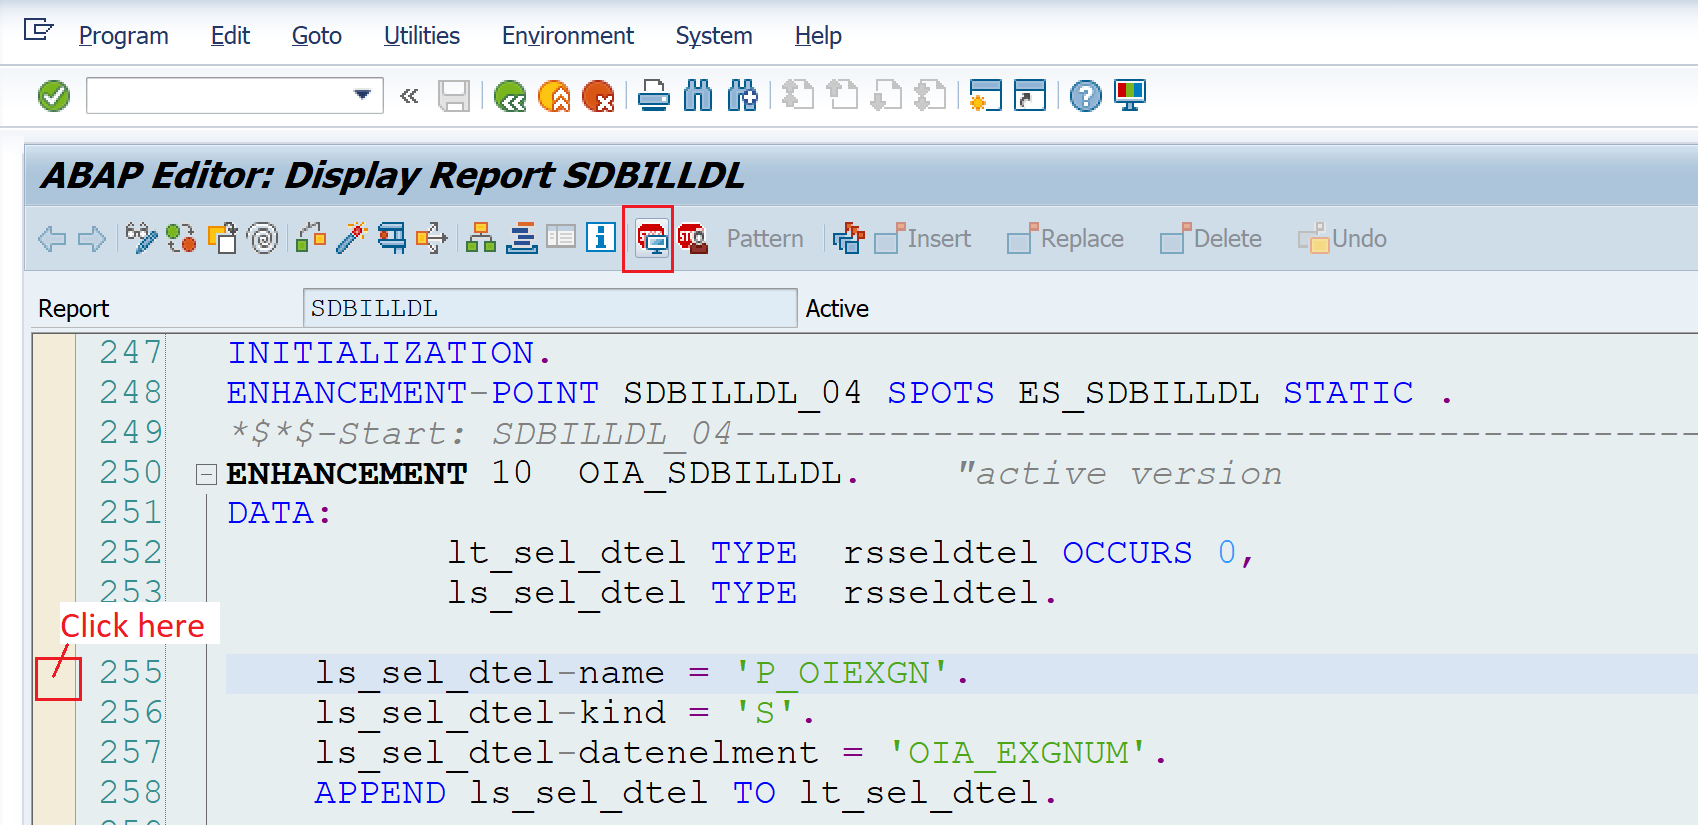
Once the break-point is set it will appear as below.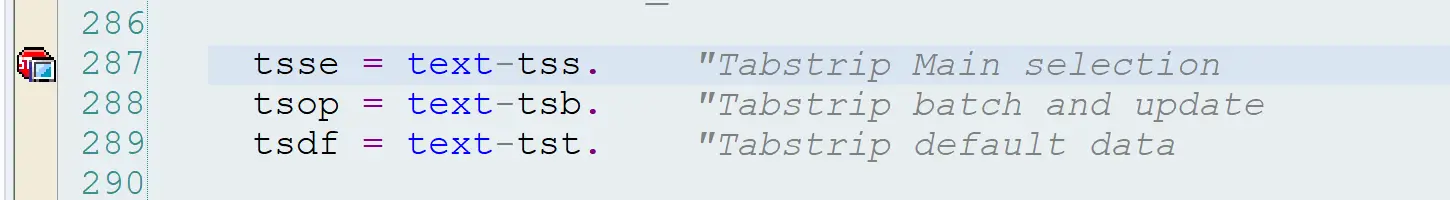
- External breakpoint
- apply to the current user session in the same way as session breakpoints
- they remain valid for future user sessions – usually, there is a time limit on the validity of this breakpoint
- this works in sessions initiated with RFC or HTTP requests.
The process to set these break-points is similar to that of session break-point. Utilities>External Breakpoints>Set/Delete External Breakpoint.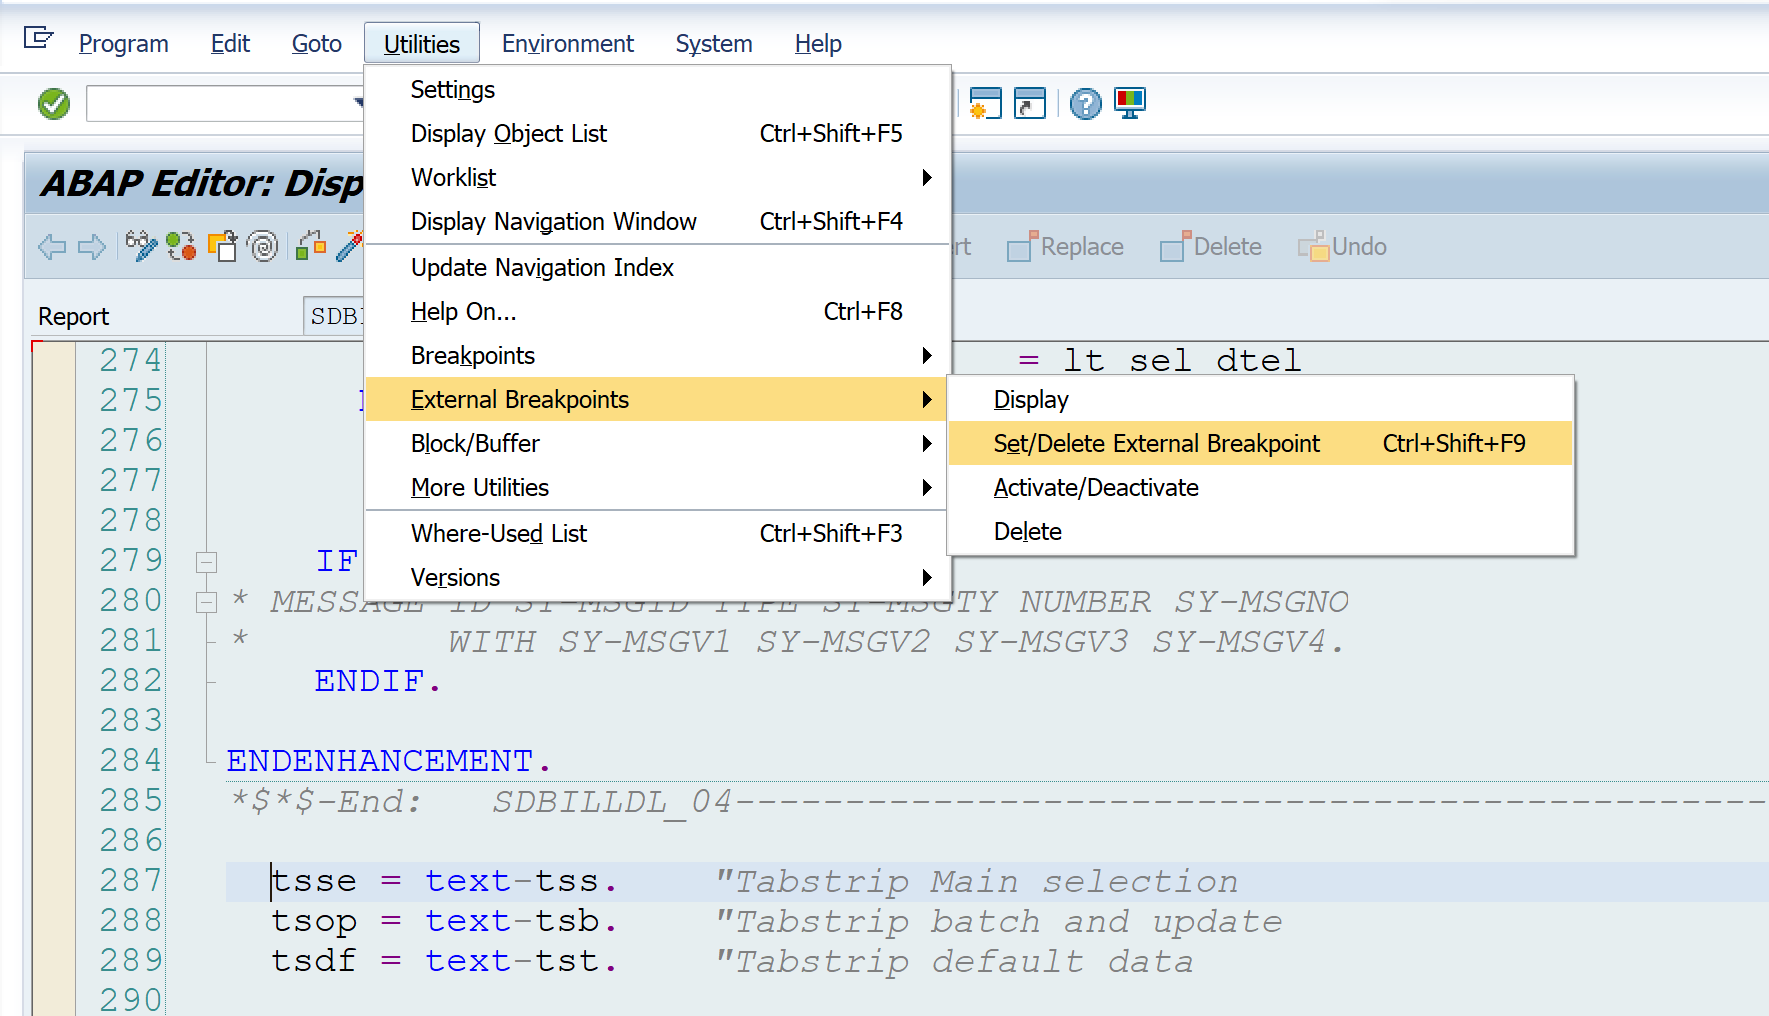
Use the application toolbar button.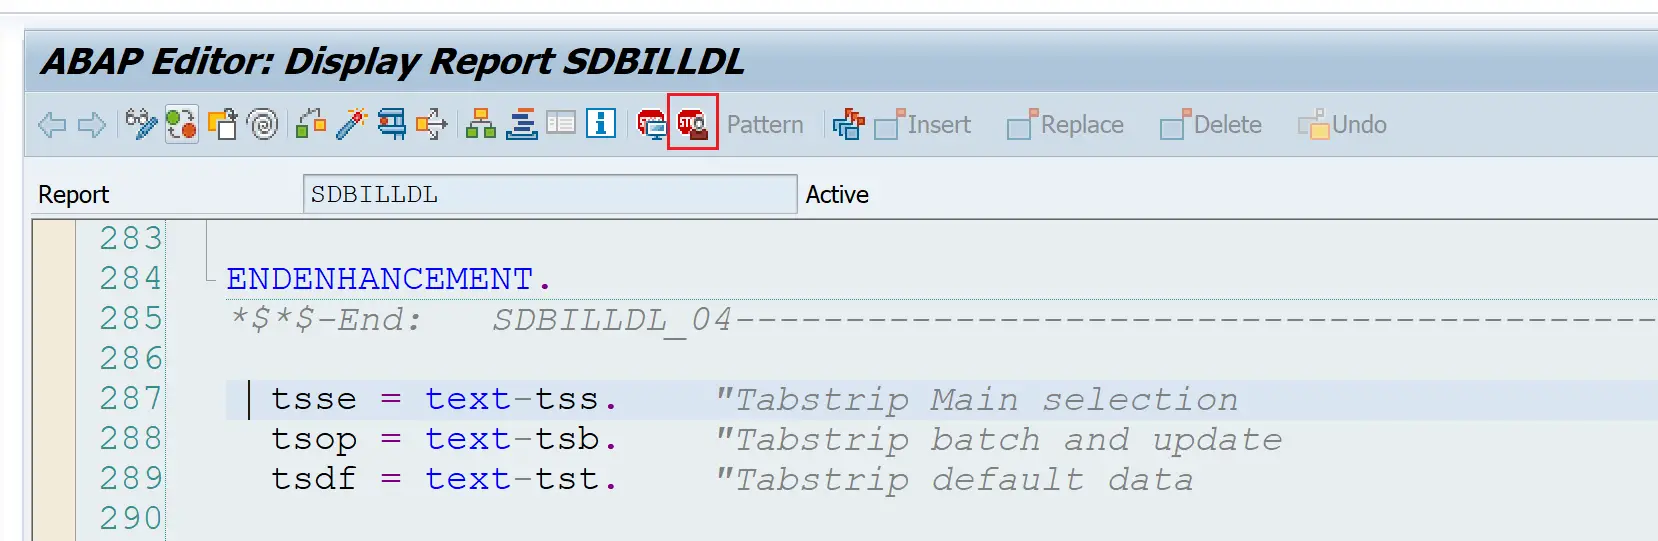
Right-click on the left margin and choosing the options also work.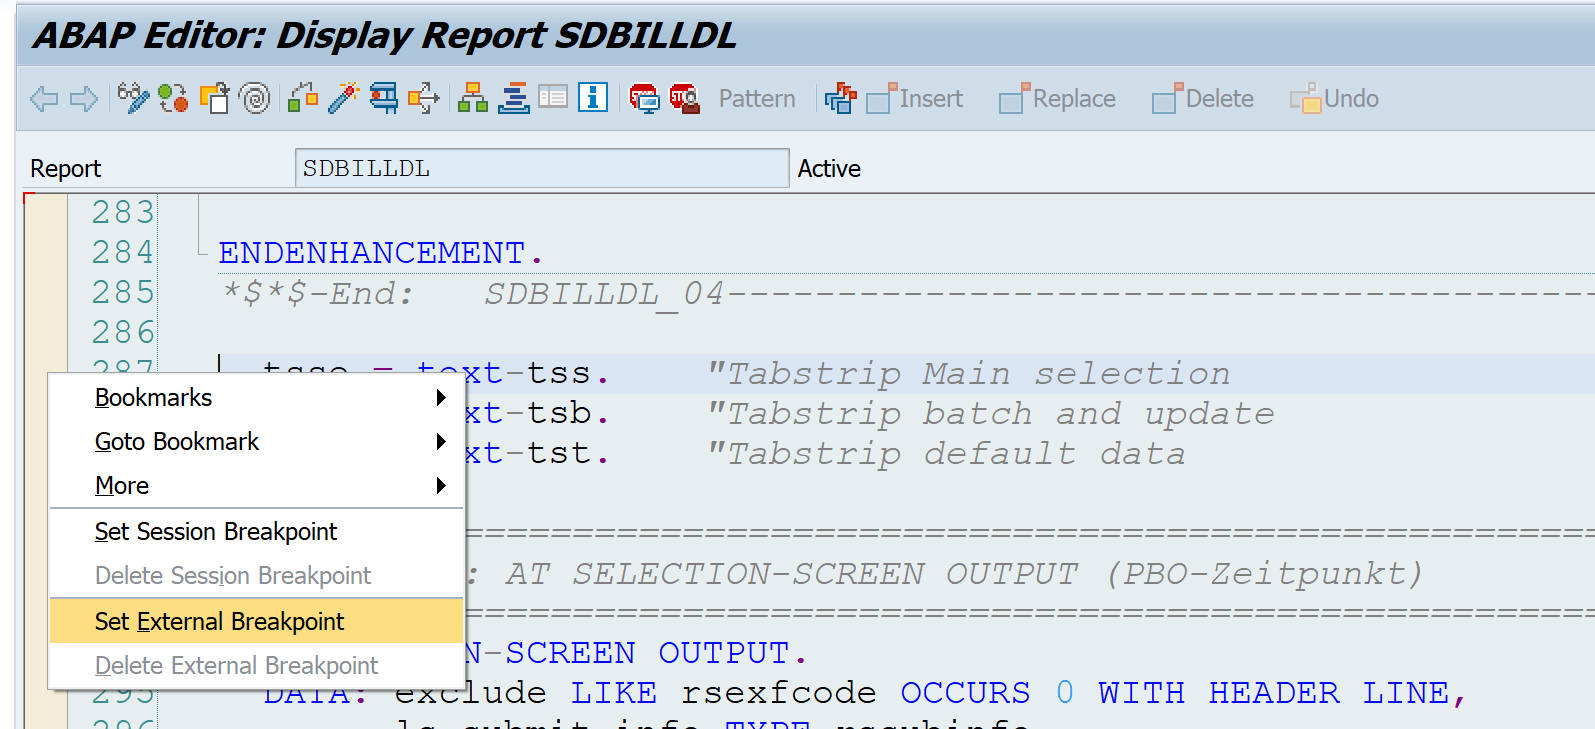
- Hard-coded breakpoint
- These are code statements and can be used in custom code only. Also, these can probably be used in the development environment.
- These statements should be removed before moving the code to the quality system
BREAK-POINT. "For all users
BREAK sapabap48. "For certain user
- Debugger breakpoints
- These are break-points that can be set directly in debug session. This will be covered in detail in the following posts of this series.
Once one of the Session or External or Hardcoded break-point is set, simply execute the program / the transaction and the debug session will start when the statement where the break-point is set is executed.
Example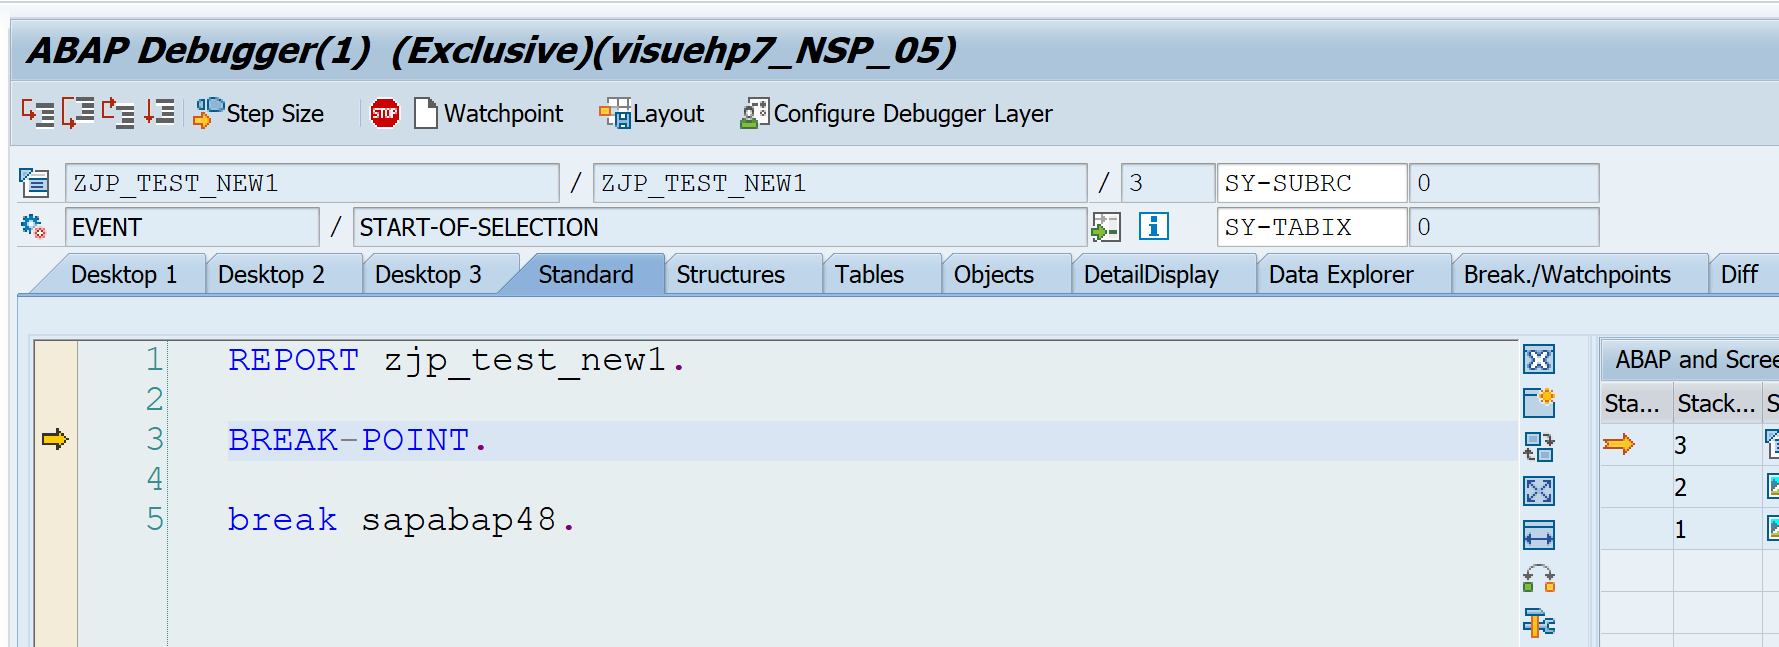
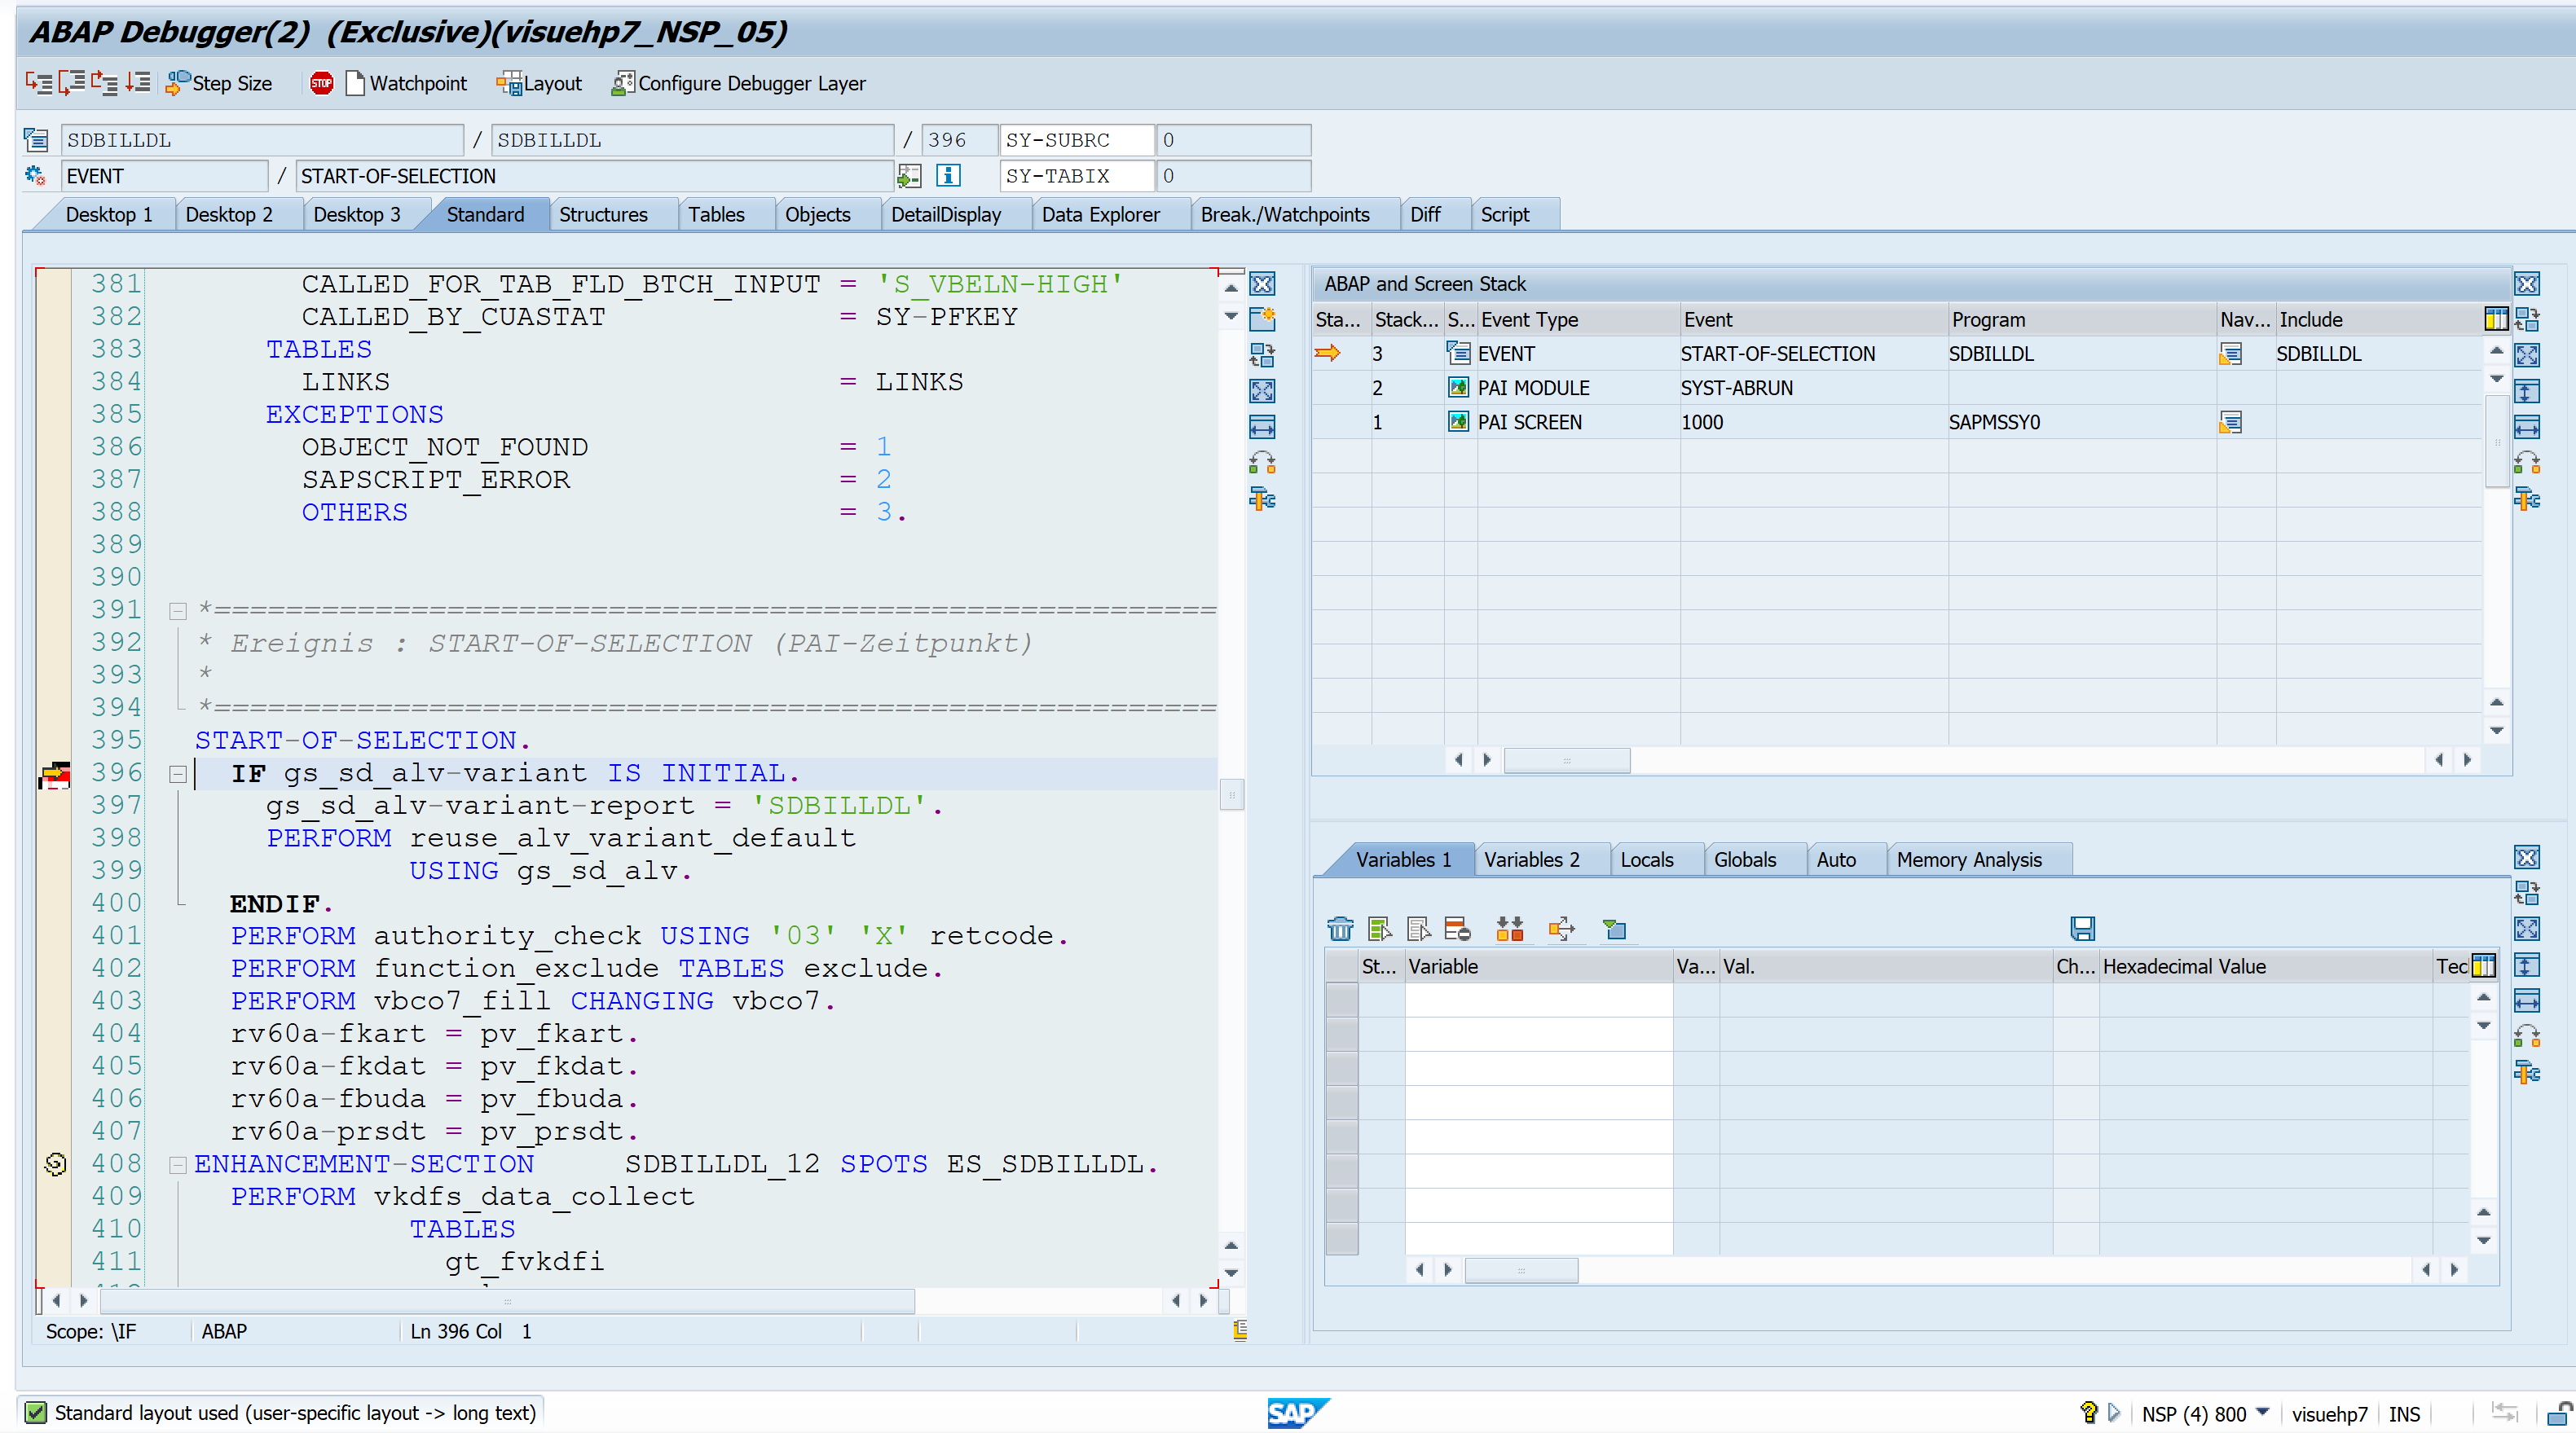
Congratulations !!! You have successfully started the debugging session.
How to debug? It’s coming up in the next post….
Visit ABAP Debugger page to see more articles on debugging.
If you like the content, please subscribe…
