This series covers all the details about ABAP debugging. If you have landed on this post directly, I recommend reading earlier posts as this post assumes that the reader has knowledge of concepts and steps covered in earlier posts.
This post talks about the configurable desktops and how they can be used to understand the data and program flow at the runtime.

A quick summary of the various desktops is as below.
| Desktop Name | Function |
|---|---|
| Desktop1, Desktop2, Desktop3, Standard | The first 4 desktops show code, variables, and stack in different window layouts. |
| Structure, Tables, Objects | These views show contents of Structure, Tables, Objects respectively at the runtime |
| Detail Display, Data Explorer | These views shows information like type of the variable. |
| Break./Watchpoints | This view shows the breakpoints and the watchpoints. |
| Diff | This view can be used to compare two variables |
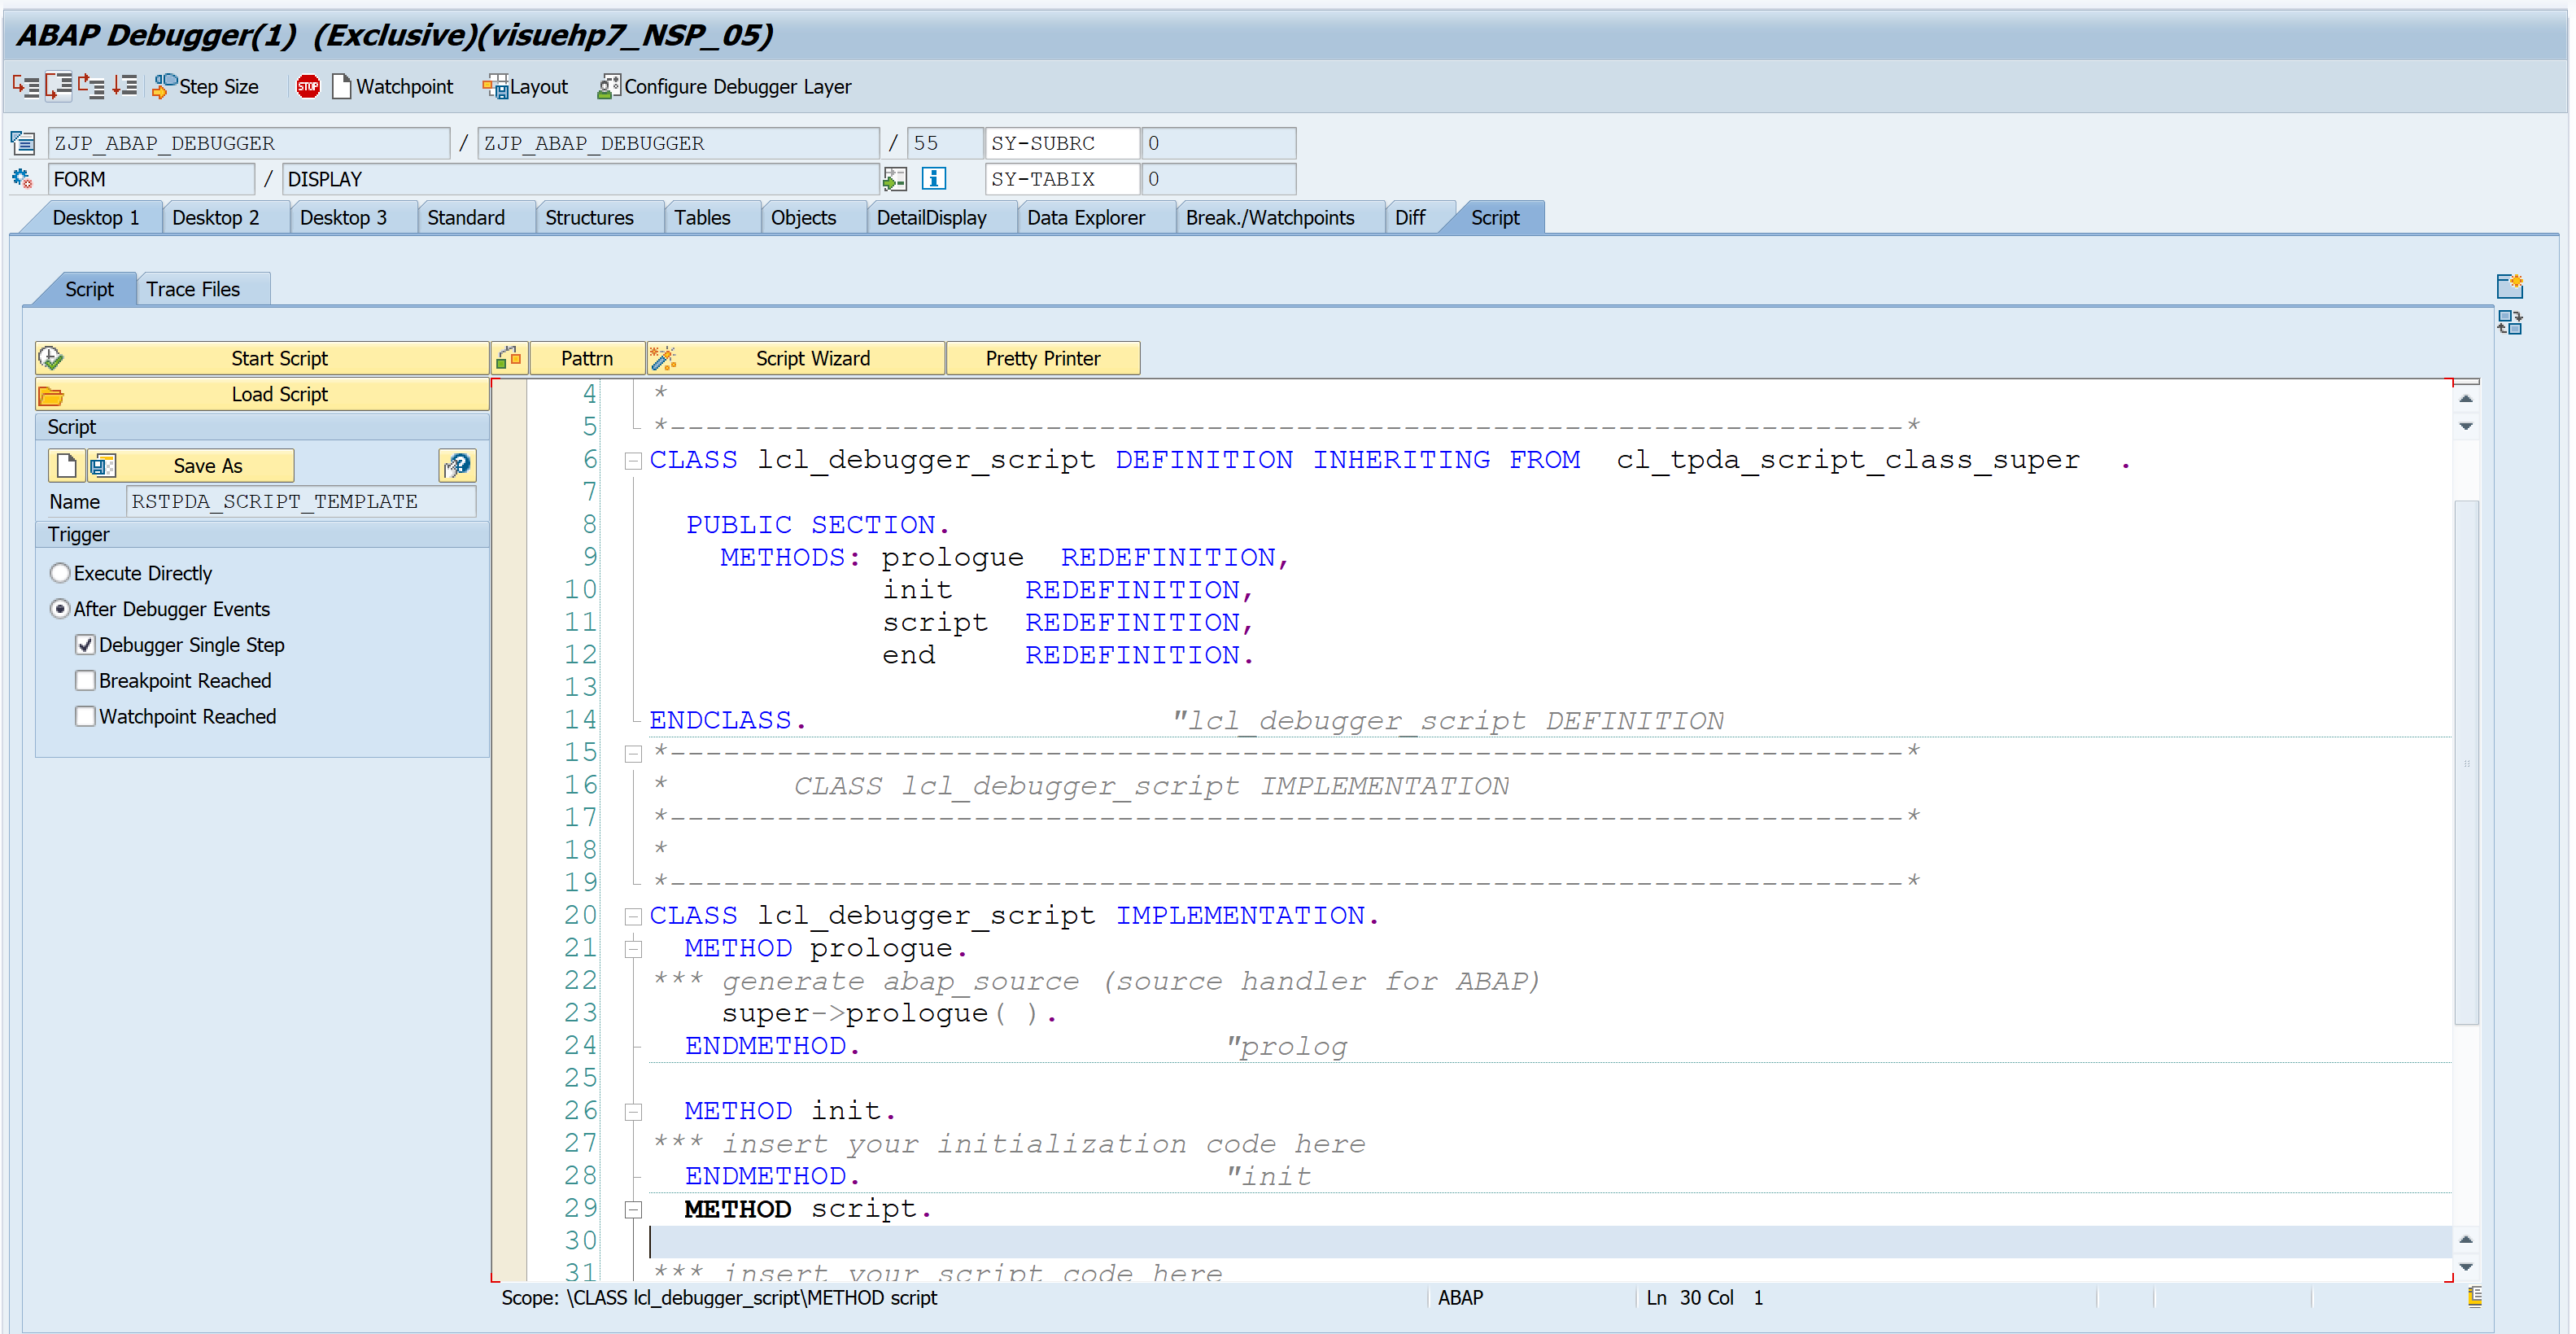
| Script | Shows the scripts where the default script RSTPDA_SCRIPT_TEMPLATE is shown. |
Out of these views the Break./Watchpoints and Script will be covered in dedicated posts later. This post will cover rest of the views.
Code of the program used for this blog is as below.
REPORT zjp_abap_debugger.

DATA : bookings TYPE STANDARD TABLE OF sbook,
       carrid   TYPE sbook-carrid.

SELECT-OPTIONS : s_carrid FOR carrid NO-DISPLAY DEFAULT 'AA'.

START-OF-SELECTION.
  PERFORM get_data.

END-OF-SELECTION.
  PERFORM display.

  IF 1 = 2.  "Dummy statements
  ENDIF.

*&---------------------------------------------------------------------*
*&      Form  GET_DATA
*&---------------------------------------------------------------------*
*       text
*----------------------------------------------------------------------*
*  -->  p1        text
*  <--  p2        text
*----------------------------------------------------------------------*
FORM get_data .
  SELECT * FROM sbook INTO TABLE @bookings
    WHERE carrid IN @s_carrid.
ENDFORM.

*&---------------------------------------------------------------------*
*&      Form  DISPLAY
*&---------------------------------------------------------------------*
*       text
*----------------------------------------------------------------------*
*  -->  p1        text
*  <--  p2        text
*----------------------------------------------------------------------*
FORM display .

  DATA : cancelled_bookings LIKE bookings,
         confirmed_bookings LIKE bookings.

  LOOP AT bookings INTO DATA(booking).
    IF booking-cancelled = abap_true.
      APPEND booking TO cancelled_bookings.
    ELSE.
      APPEND booking TO confirmed_bookings.
    ENDIF.
  ENDLOOP.

  TRY.
      "Create ALV table object for the output data table
      cl_salv_table=>factory( IMPORTING r_salv_table = DATA(lo_tab)
                              CHANGING  t_table      = confirmed_bookings ).
      lo_tab->get_functions( )->set_all( ).
      lo_tab->get_columns( )->set_optimize( ).
      lo_tab->get_display_settings( )->set_striped_pattern( abap_true ).

      lo_tab->display( ).

    CATCH cx_root.
      MESSAGE 'Error in ALV creation' TYPE 'E'.
  ENDTRY.
ENDFORM.
Breakpoint is set up in Start-of-selection event, program is executed to get into the debug mode.

Debug using F5/F6 to reach to below statement.
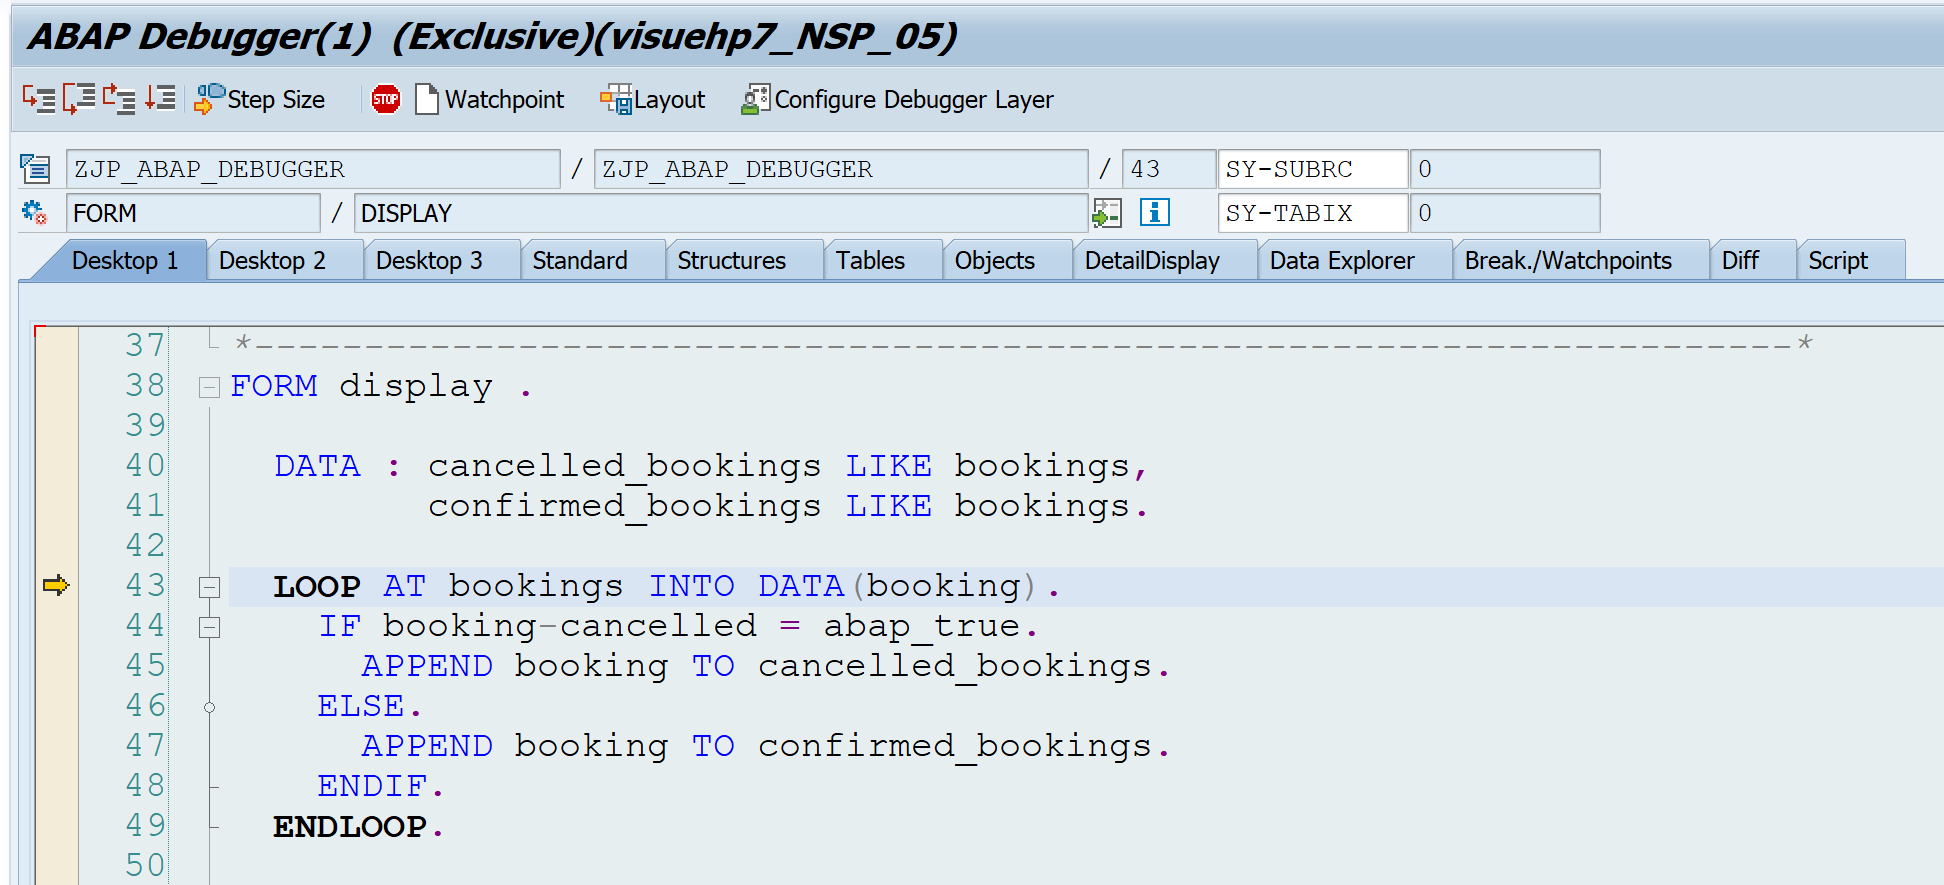
Views for Debugging Code Lines
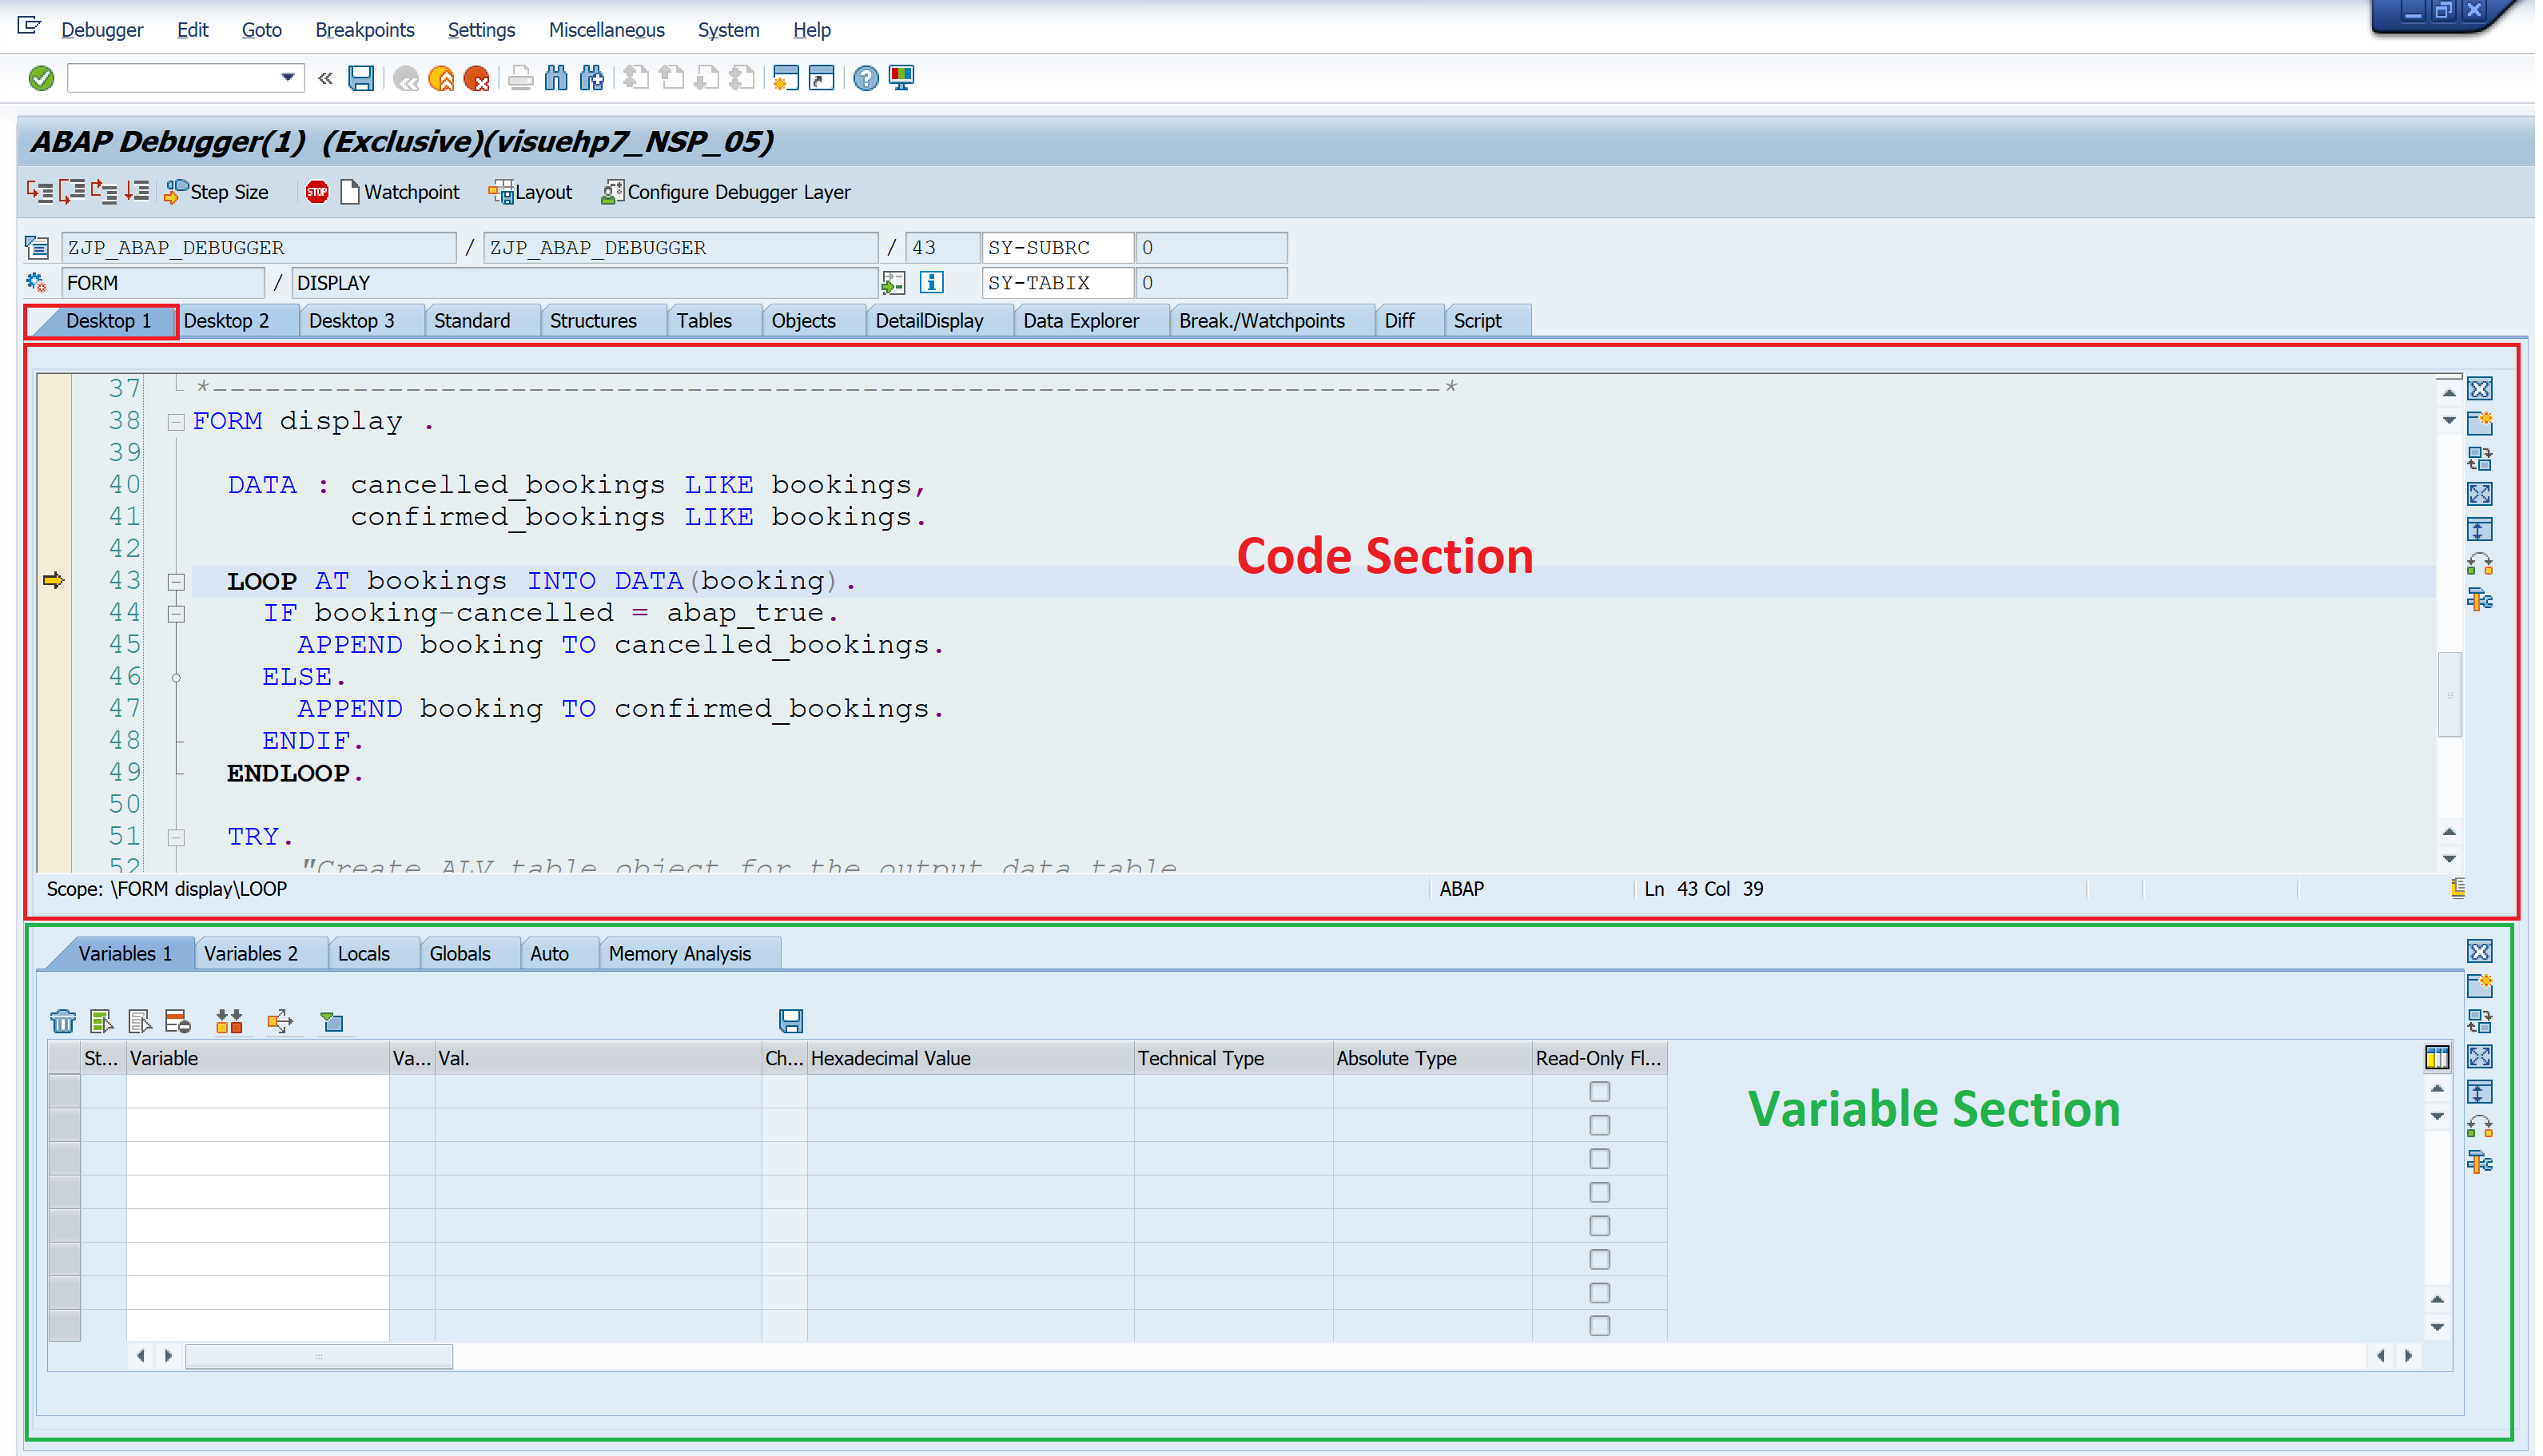
Desktop1
This desktop has one code section and one variable section split vertically allowing full width for code lines. So, this view is useful to debug the code where code lines are longer.
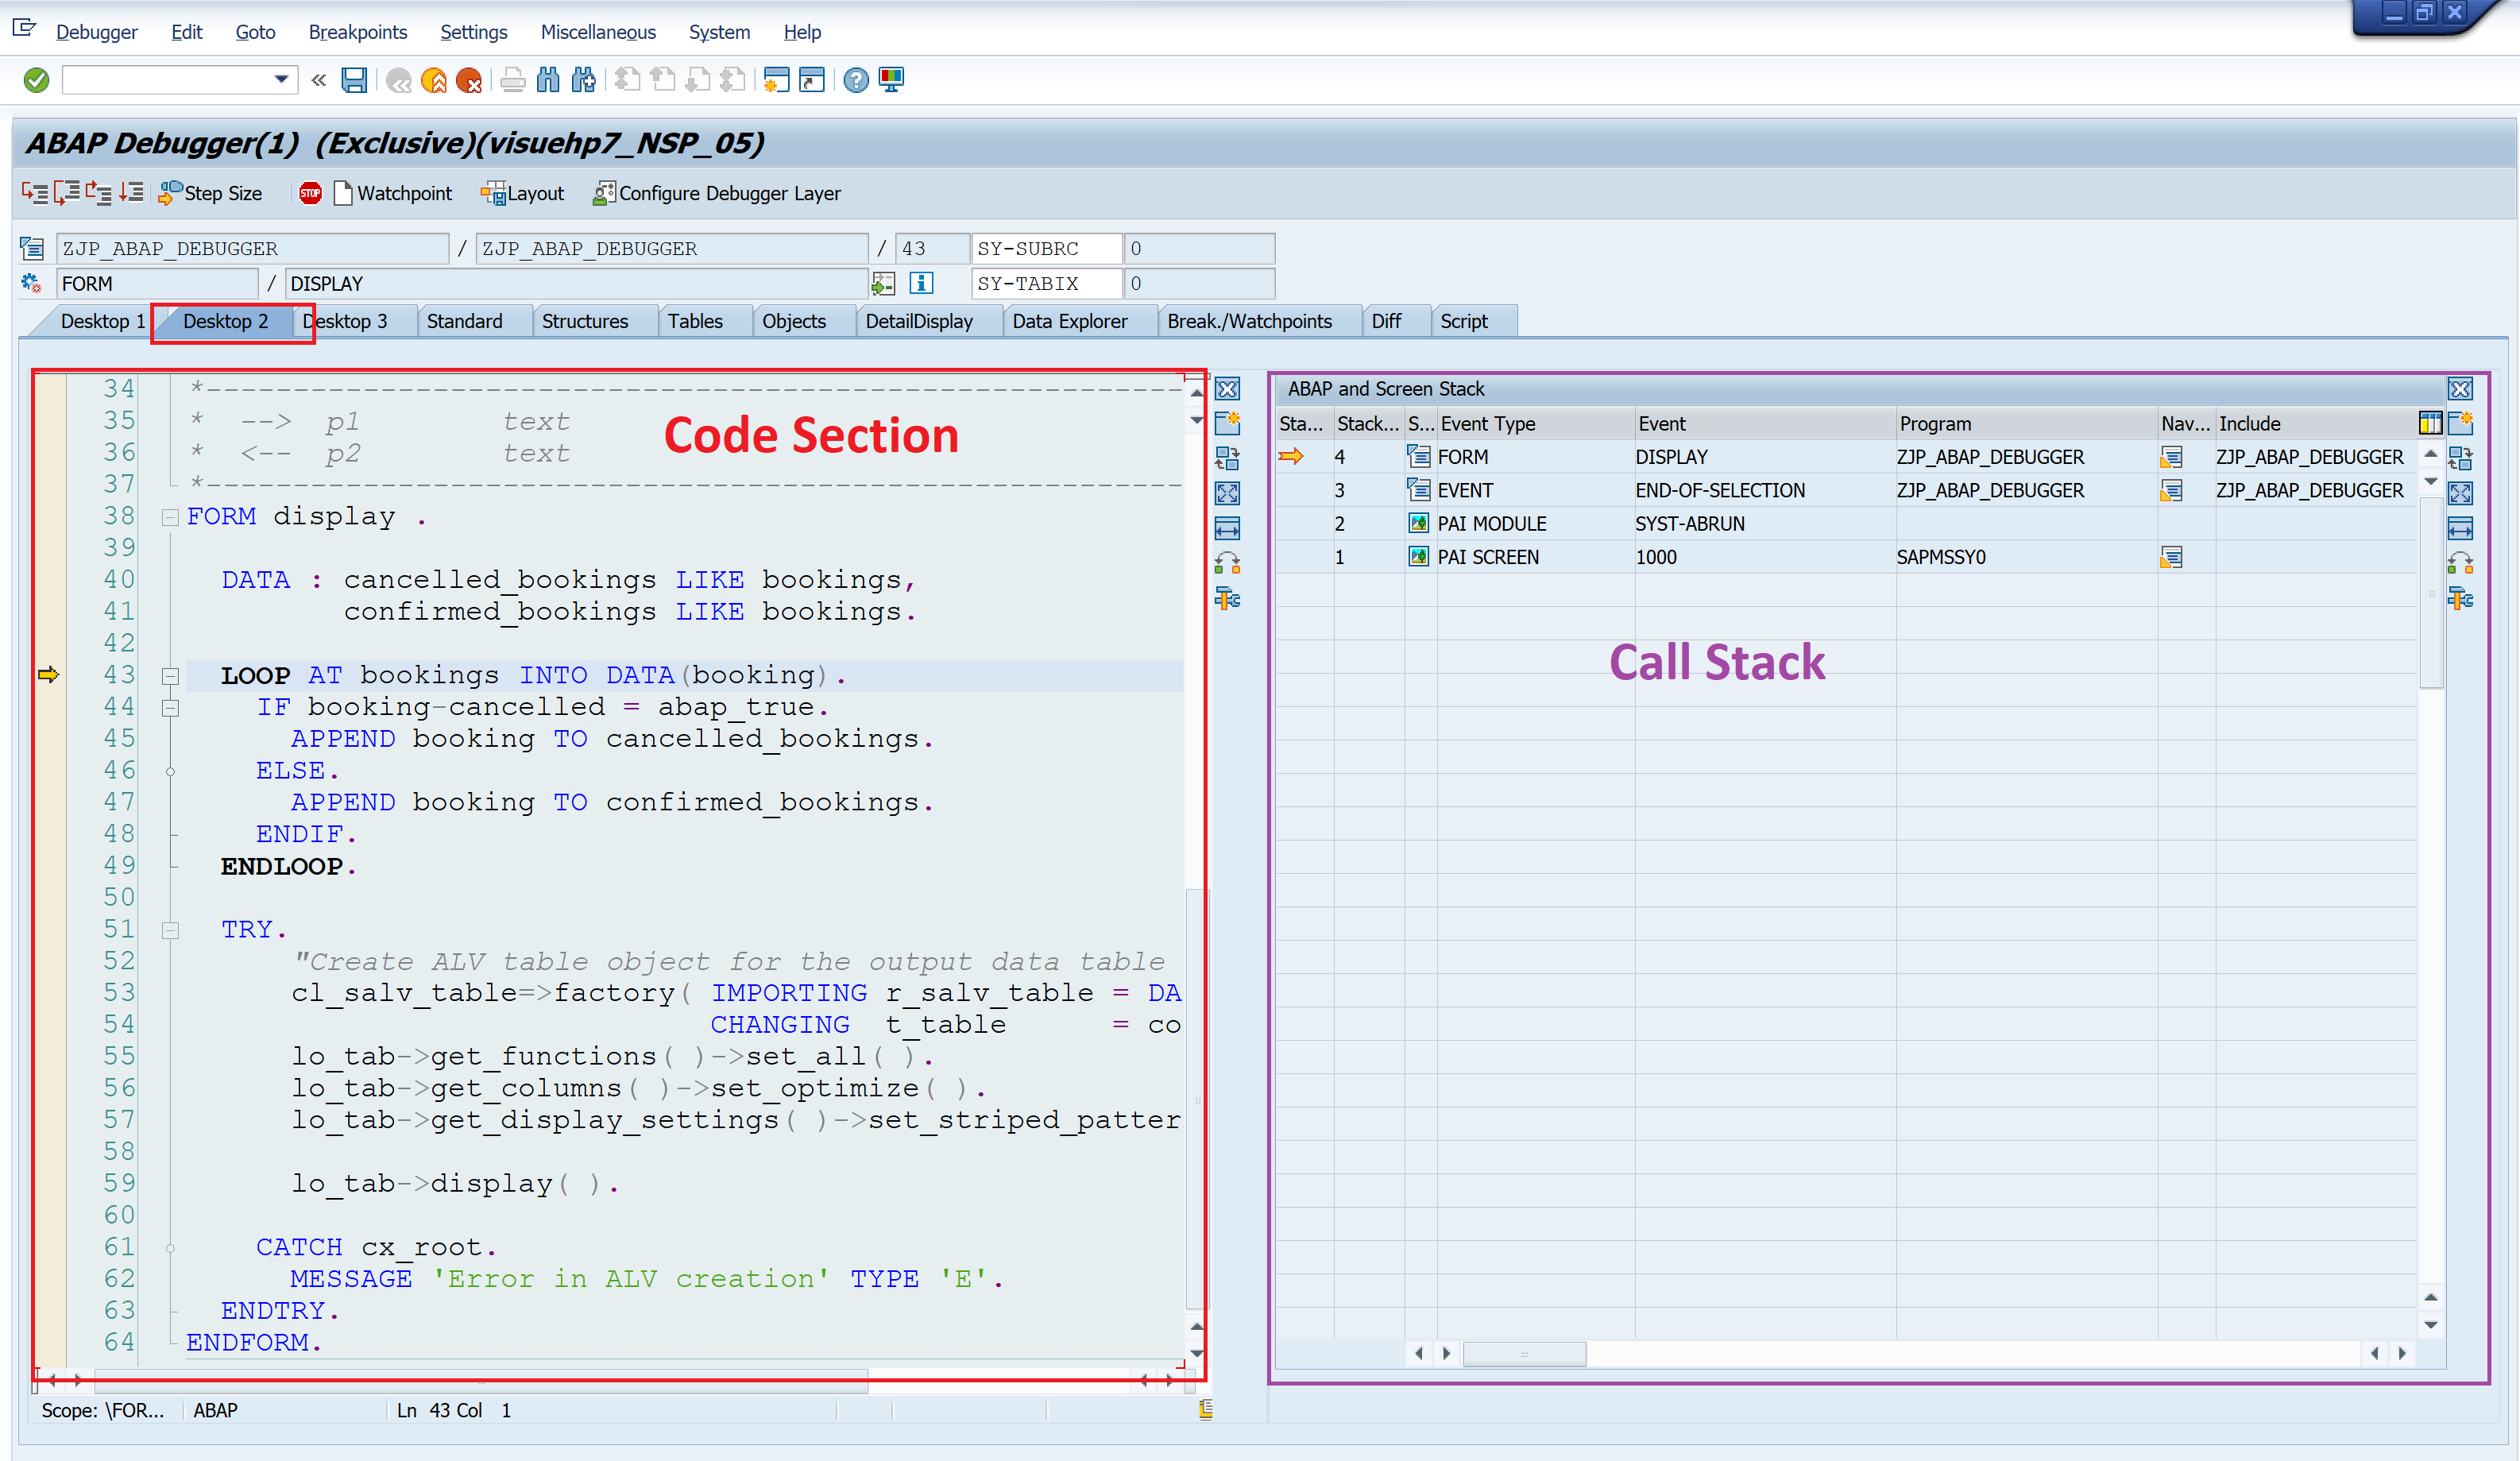
Desktop2
This desktop has one code section and ABAP and Screen Stack section split horizontally. This view is useful when we need to keep a watch on the call stack.
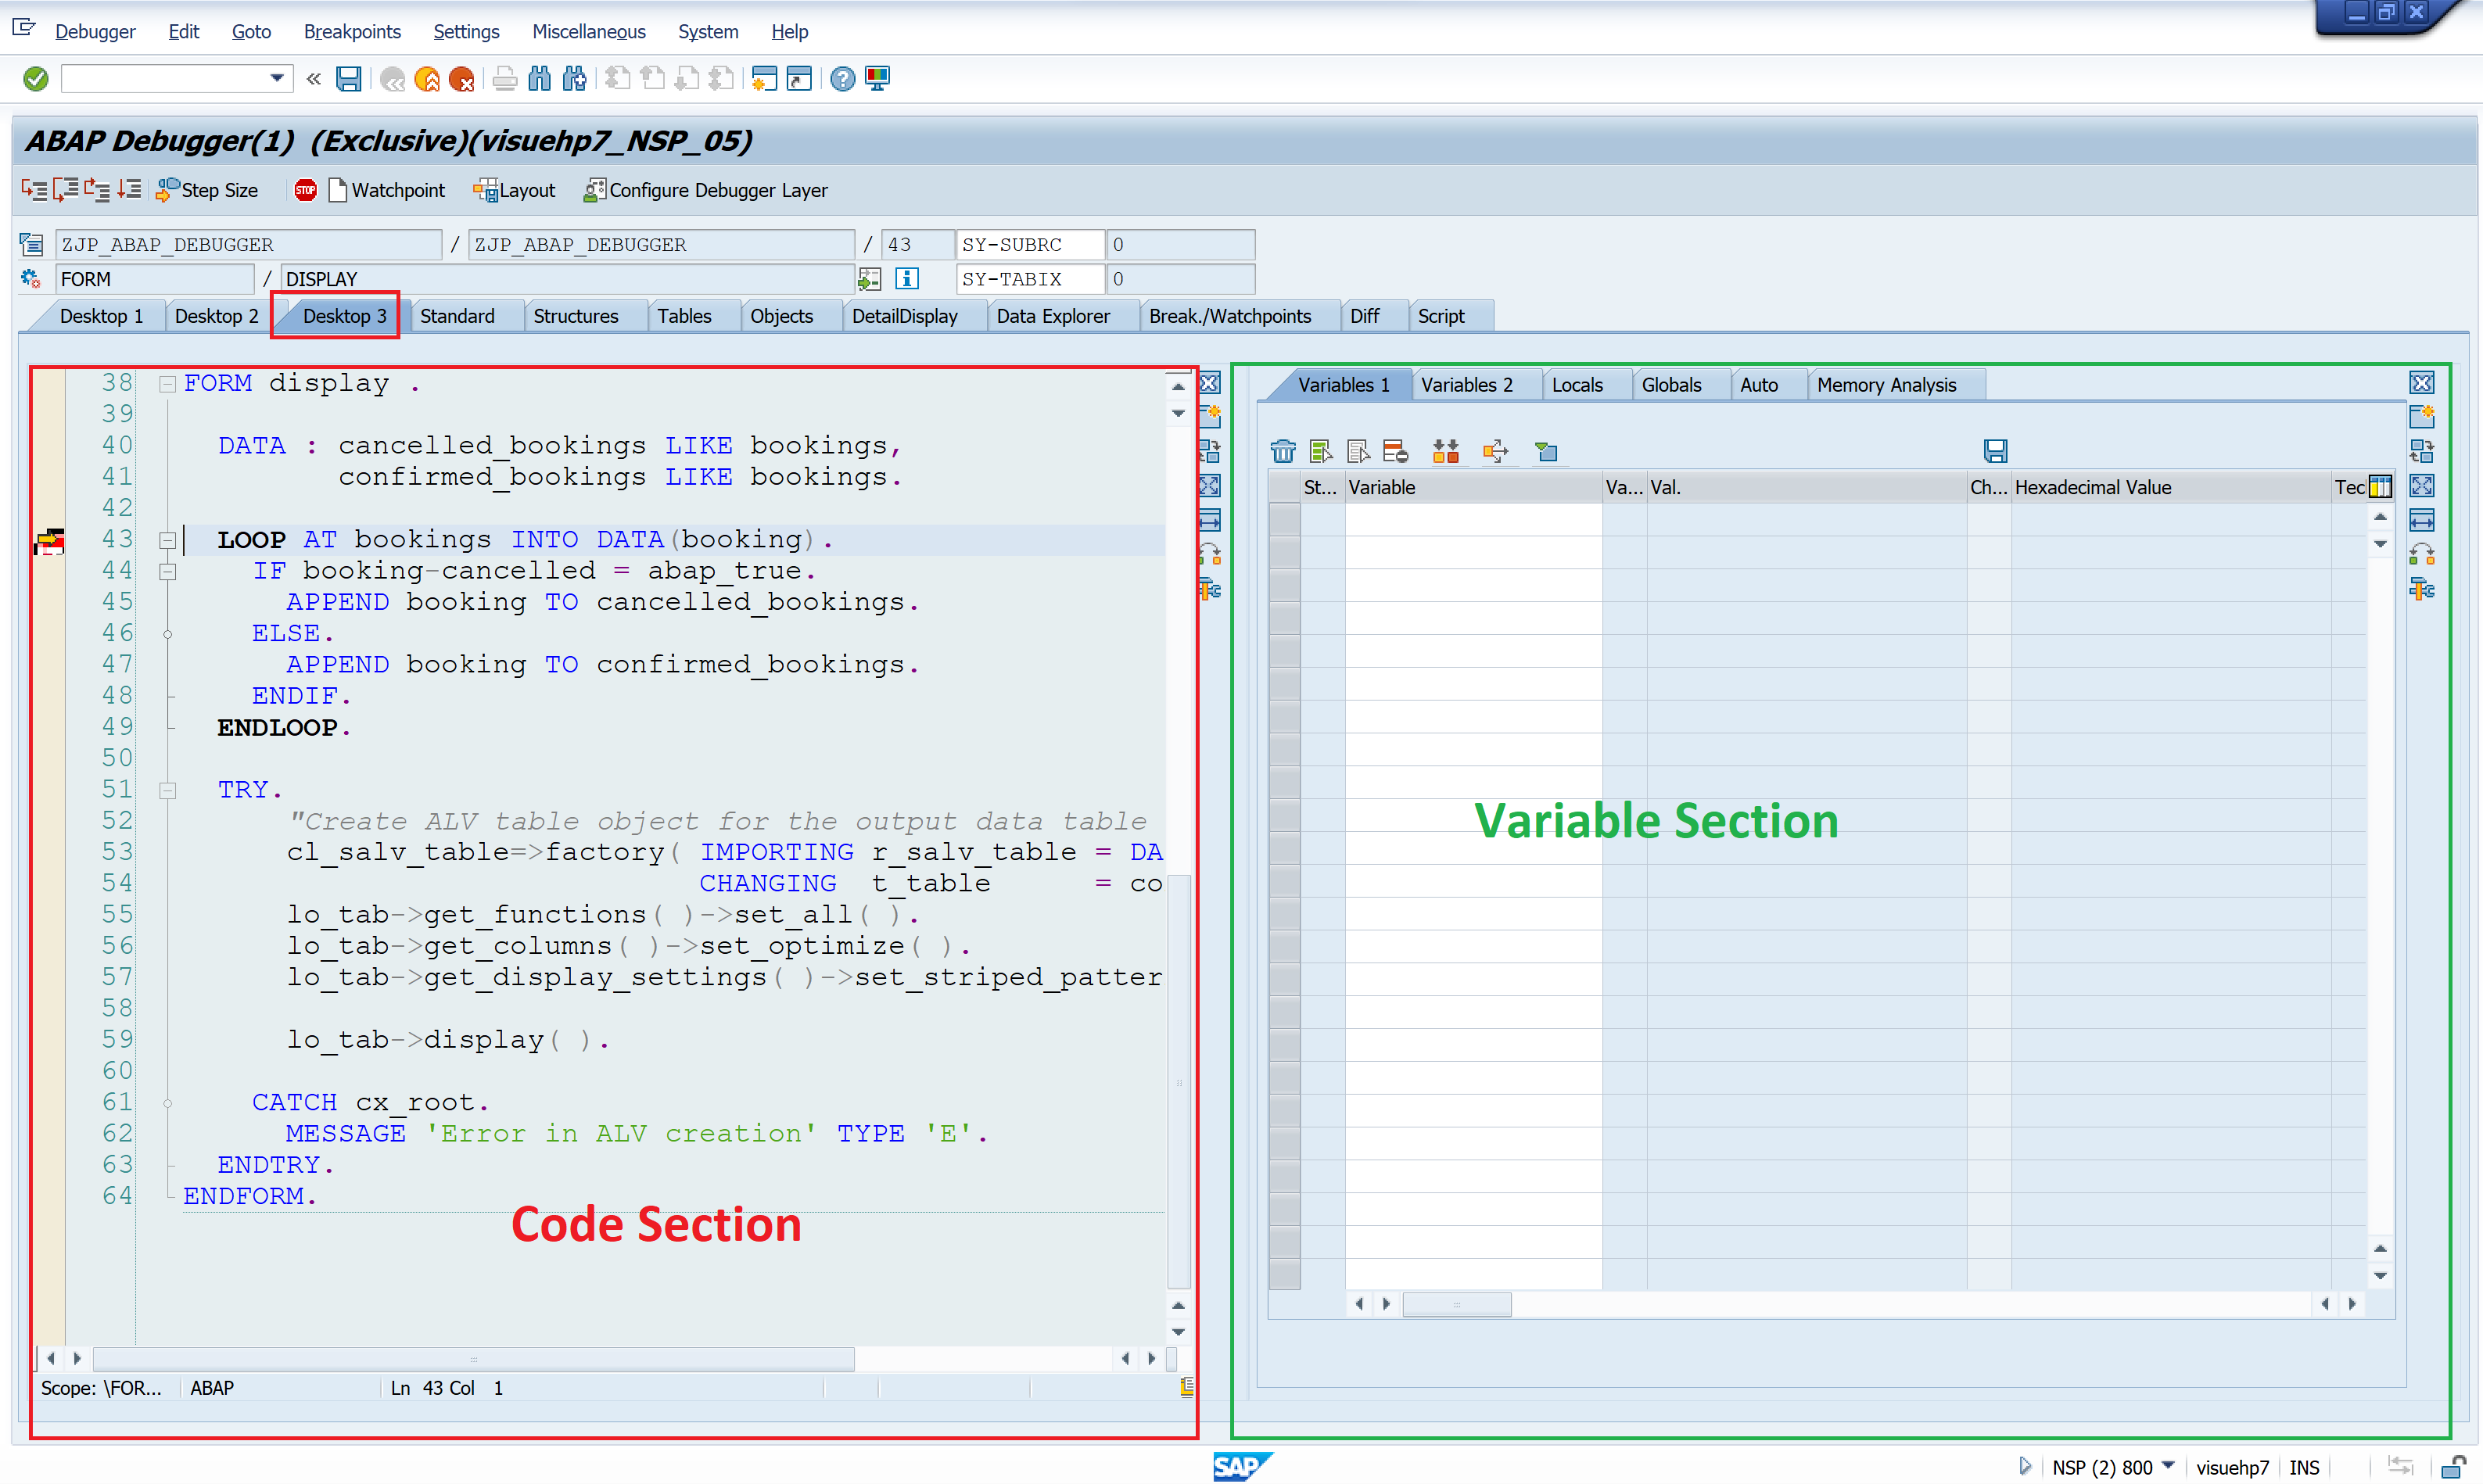
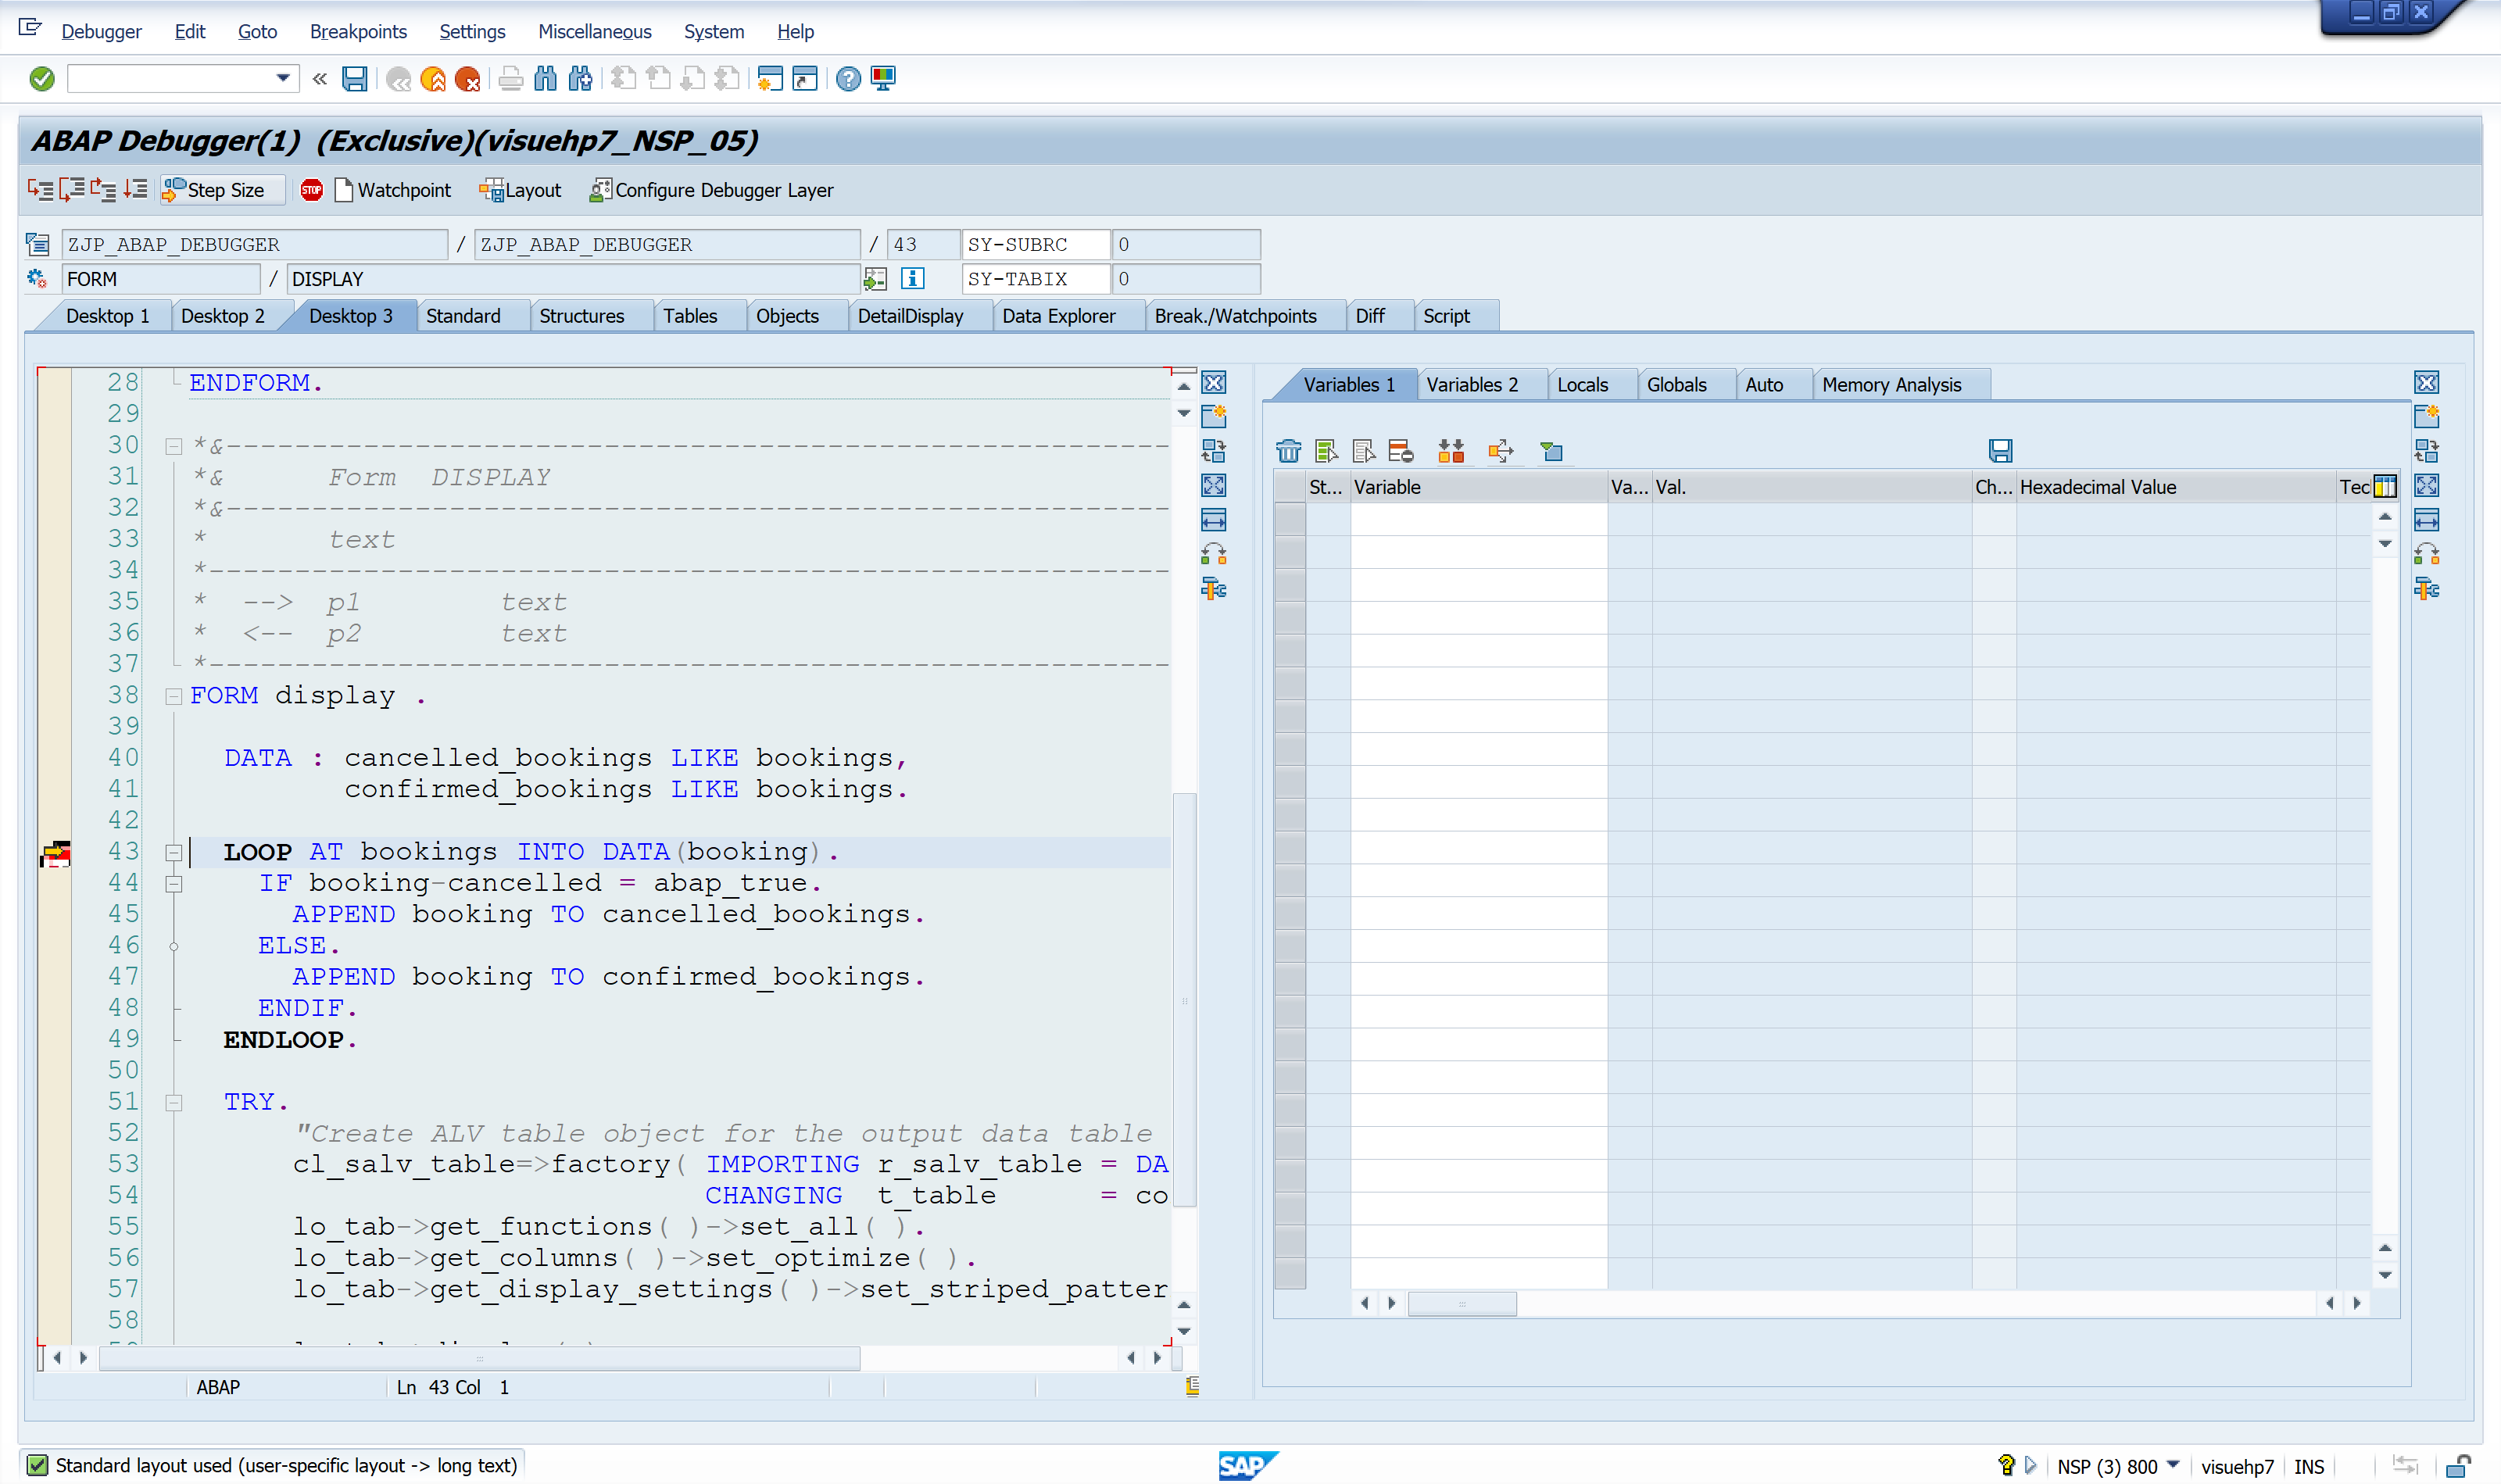
Desktop3
This desktop has one code section and one variable section split horizontally. Difference with Desktop1 is that the code section has half the width but the number of variables that can be viewed are more.
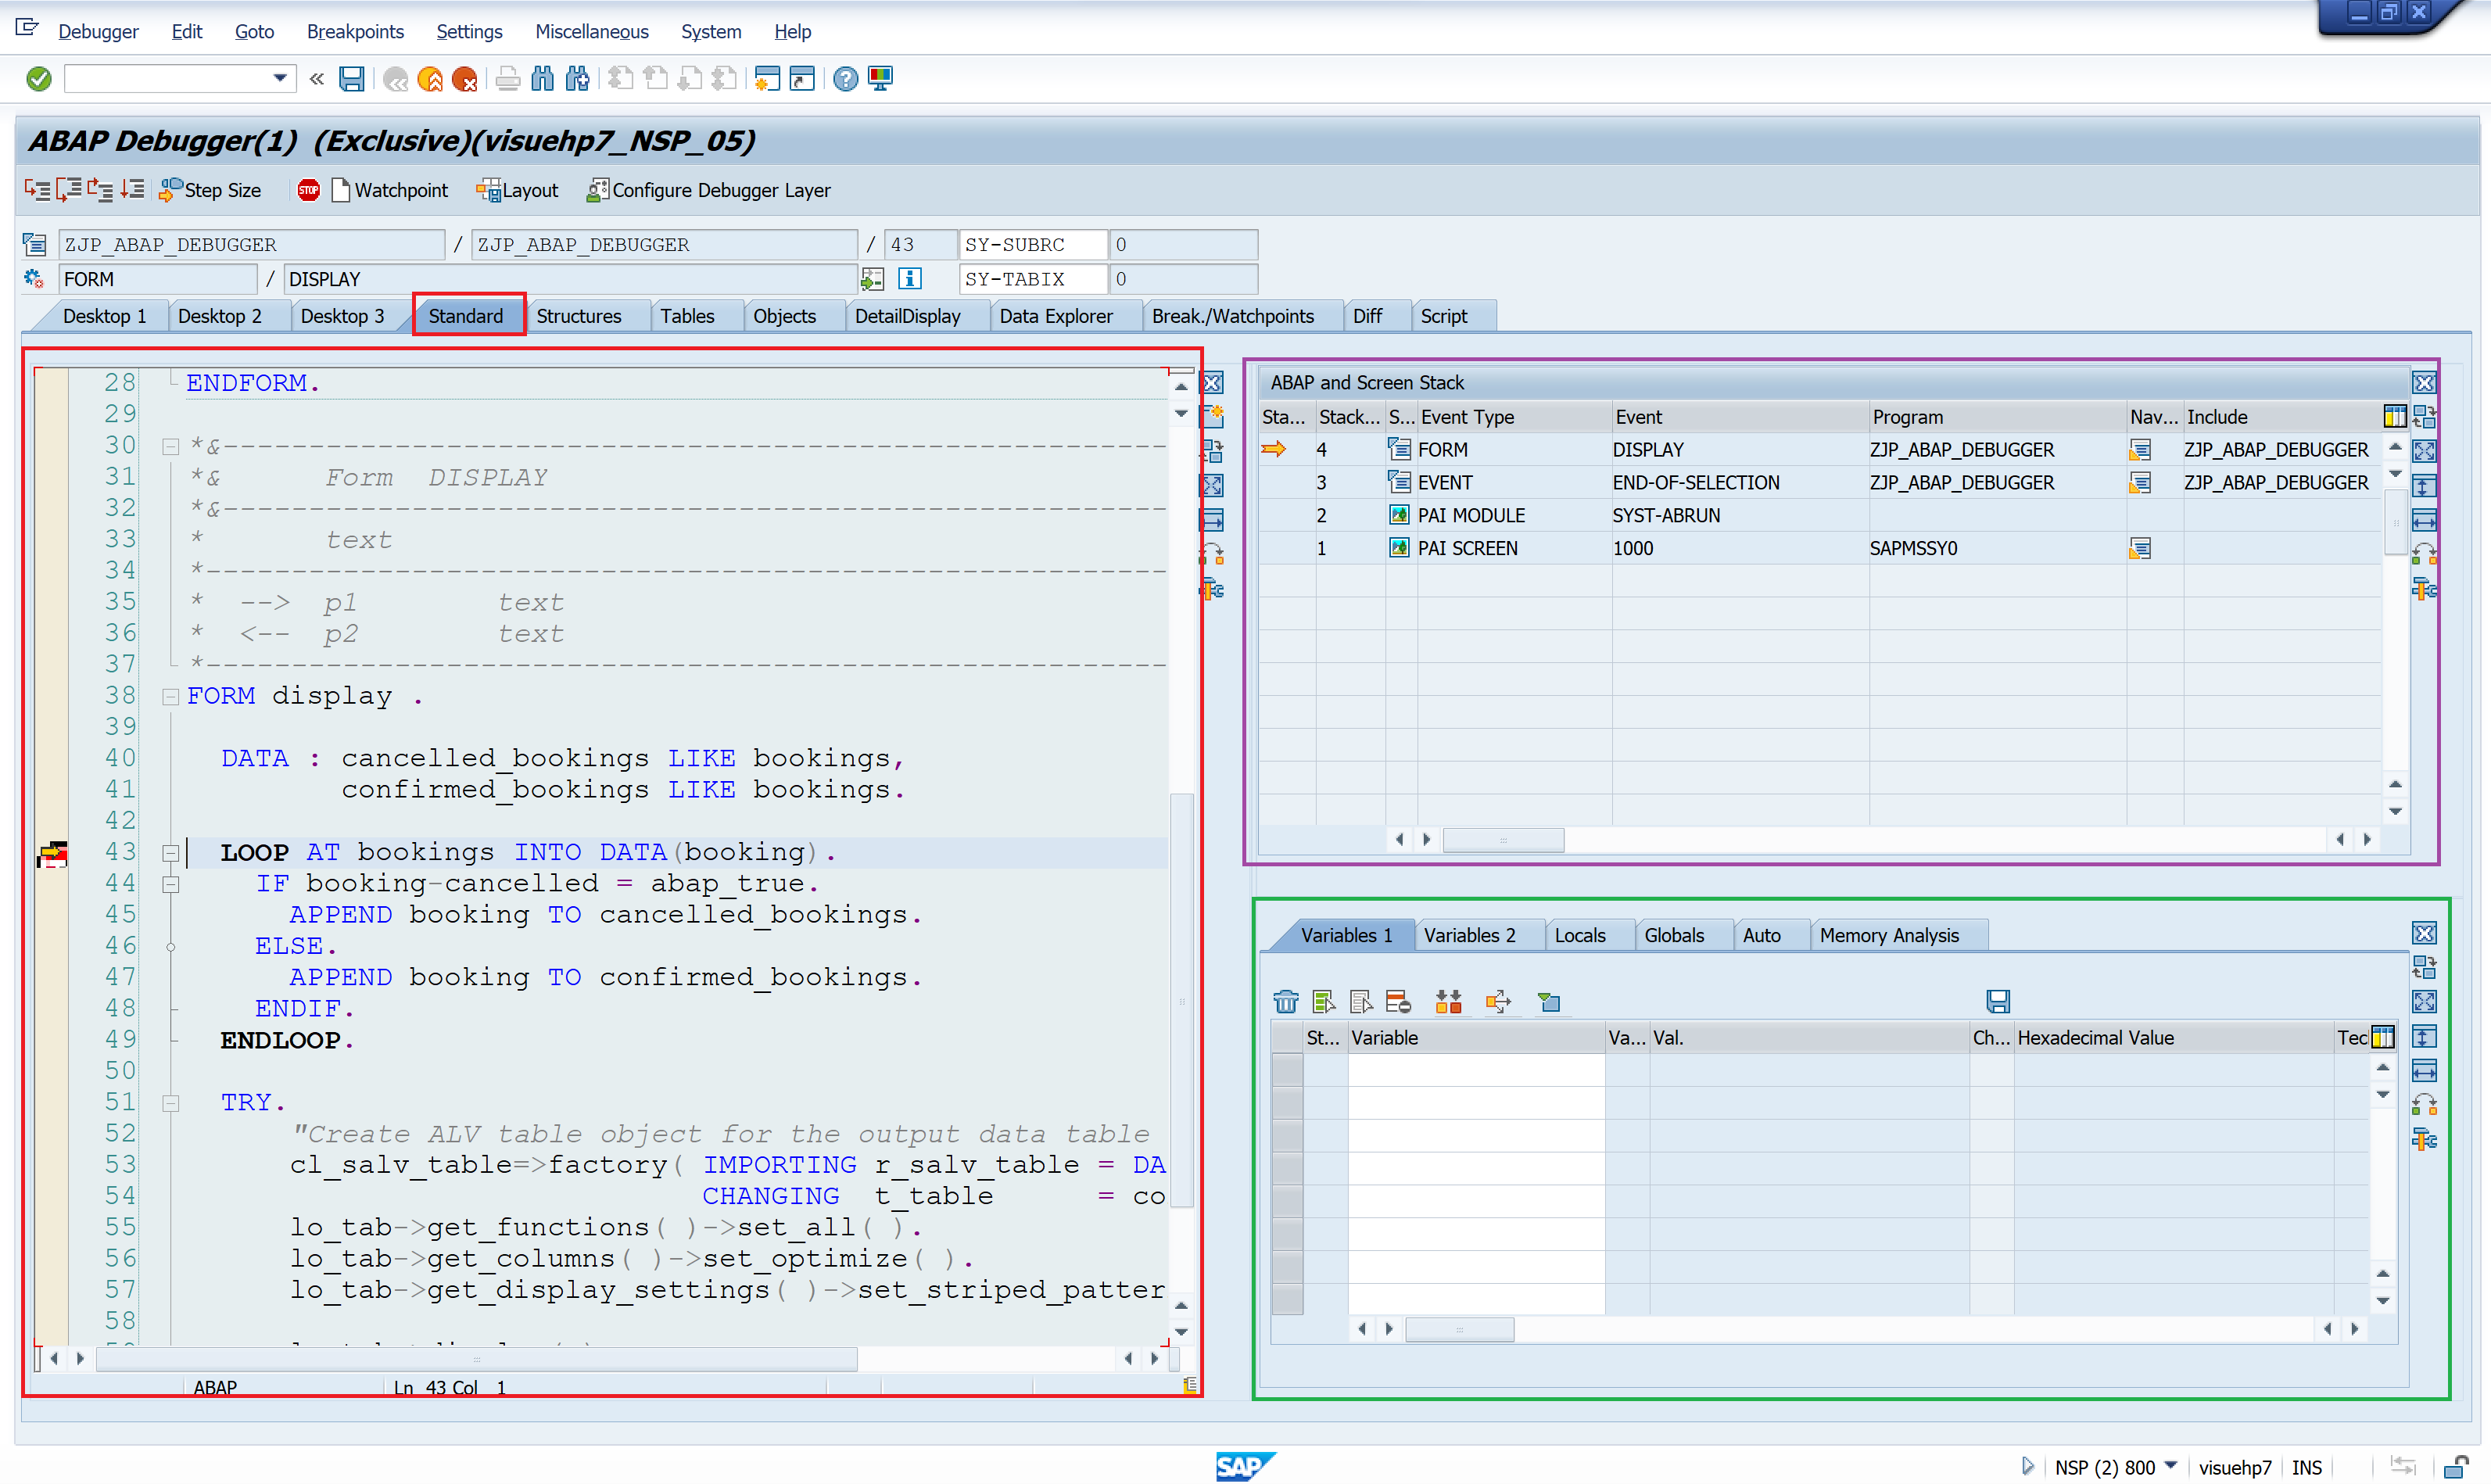
Standard
This is also, usually the default desktop when the debugging is started. It is combination of Desktop2 and Desktop3 and has code, stack and variable sections.
How to set a view as default?
I personally like the views Desktop3 and Standard depending on whether I need to look at the call stack. To make another desktop default, click on the desktop – say Desktop3 and save the layout.
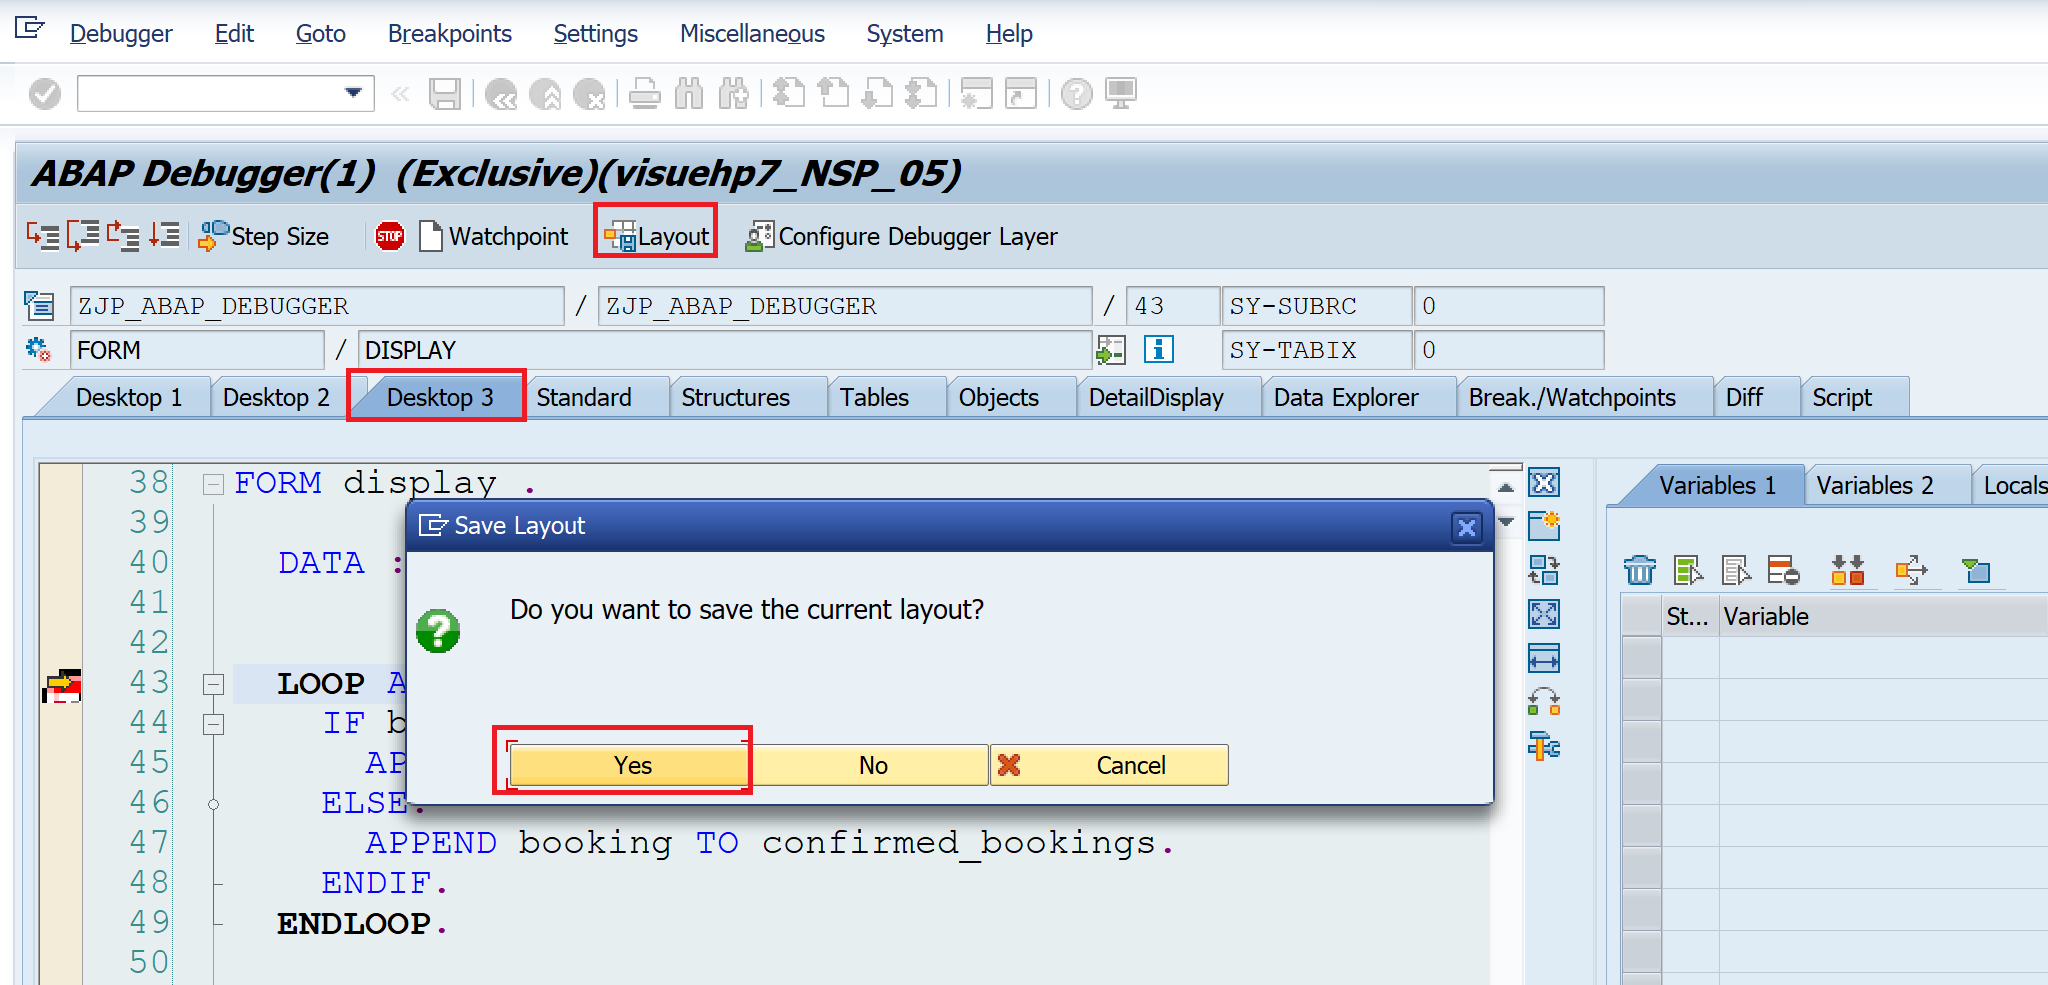
Next time you start the debugging the debugging will start in Desktop3.
Variable Contents
Before we move to next views, let us first understand how to observe variable contents.
- Double click on a variable, a structure, an internal table, or an object to load the variable in the variable section.
- Type in the name of a variable, a structure, an internal table, or an object directly in the variable section
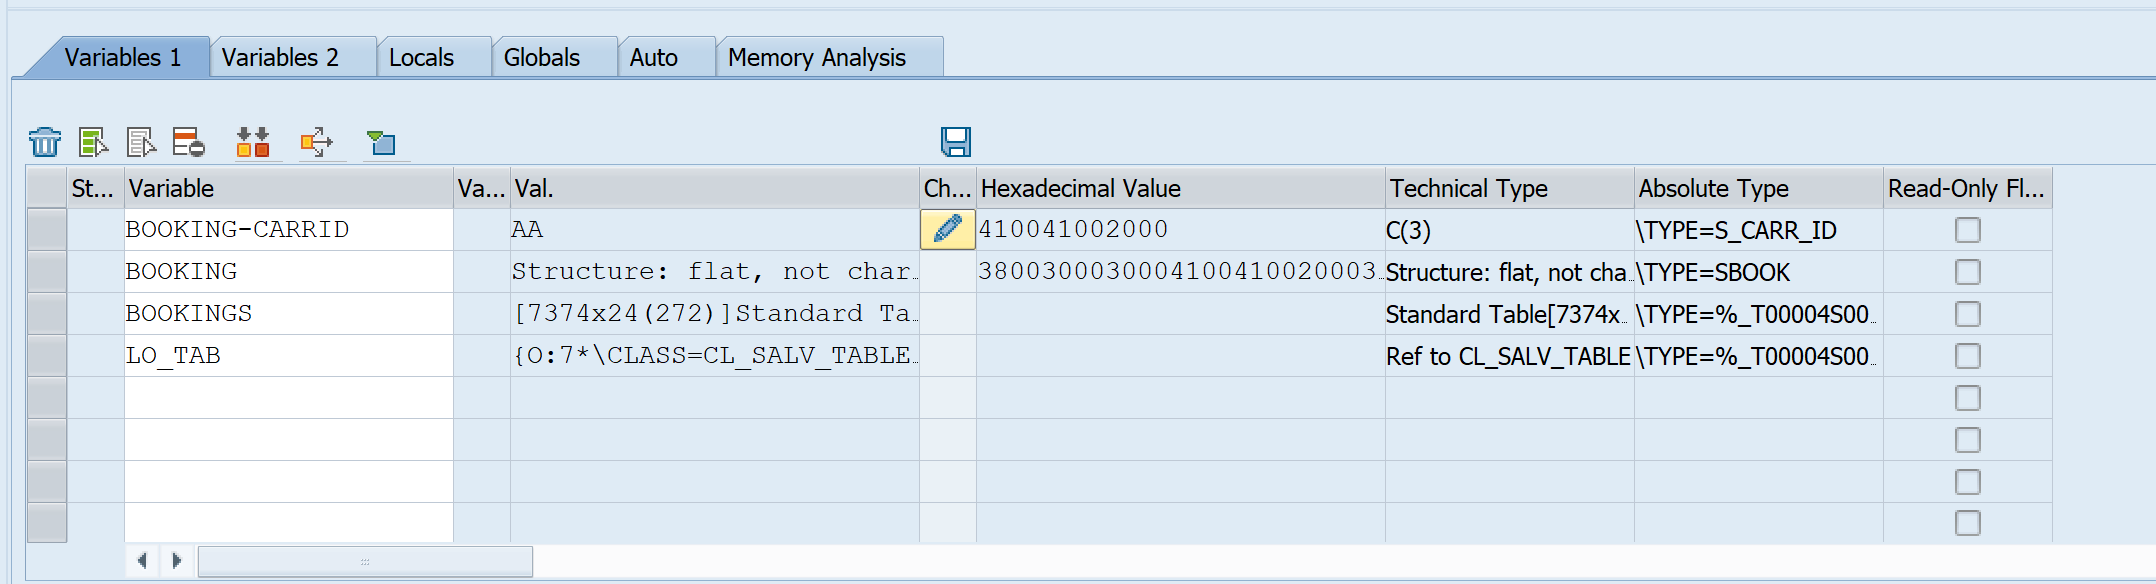
| Variable | BOOKING-CARRID | Shows content in column Value(Val.) |
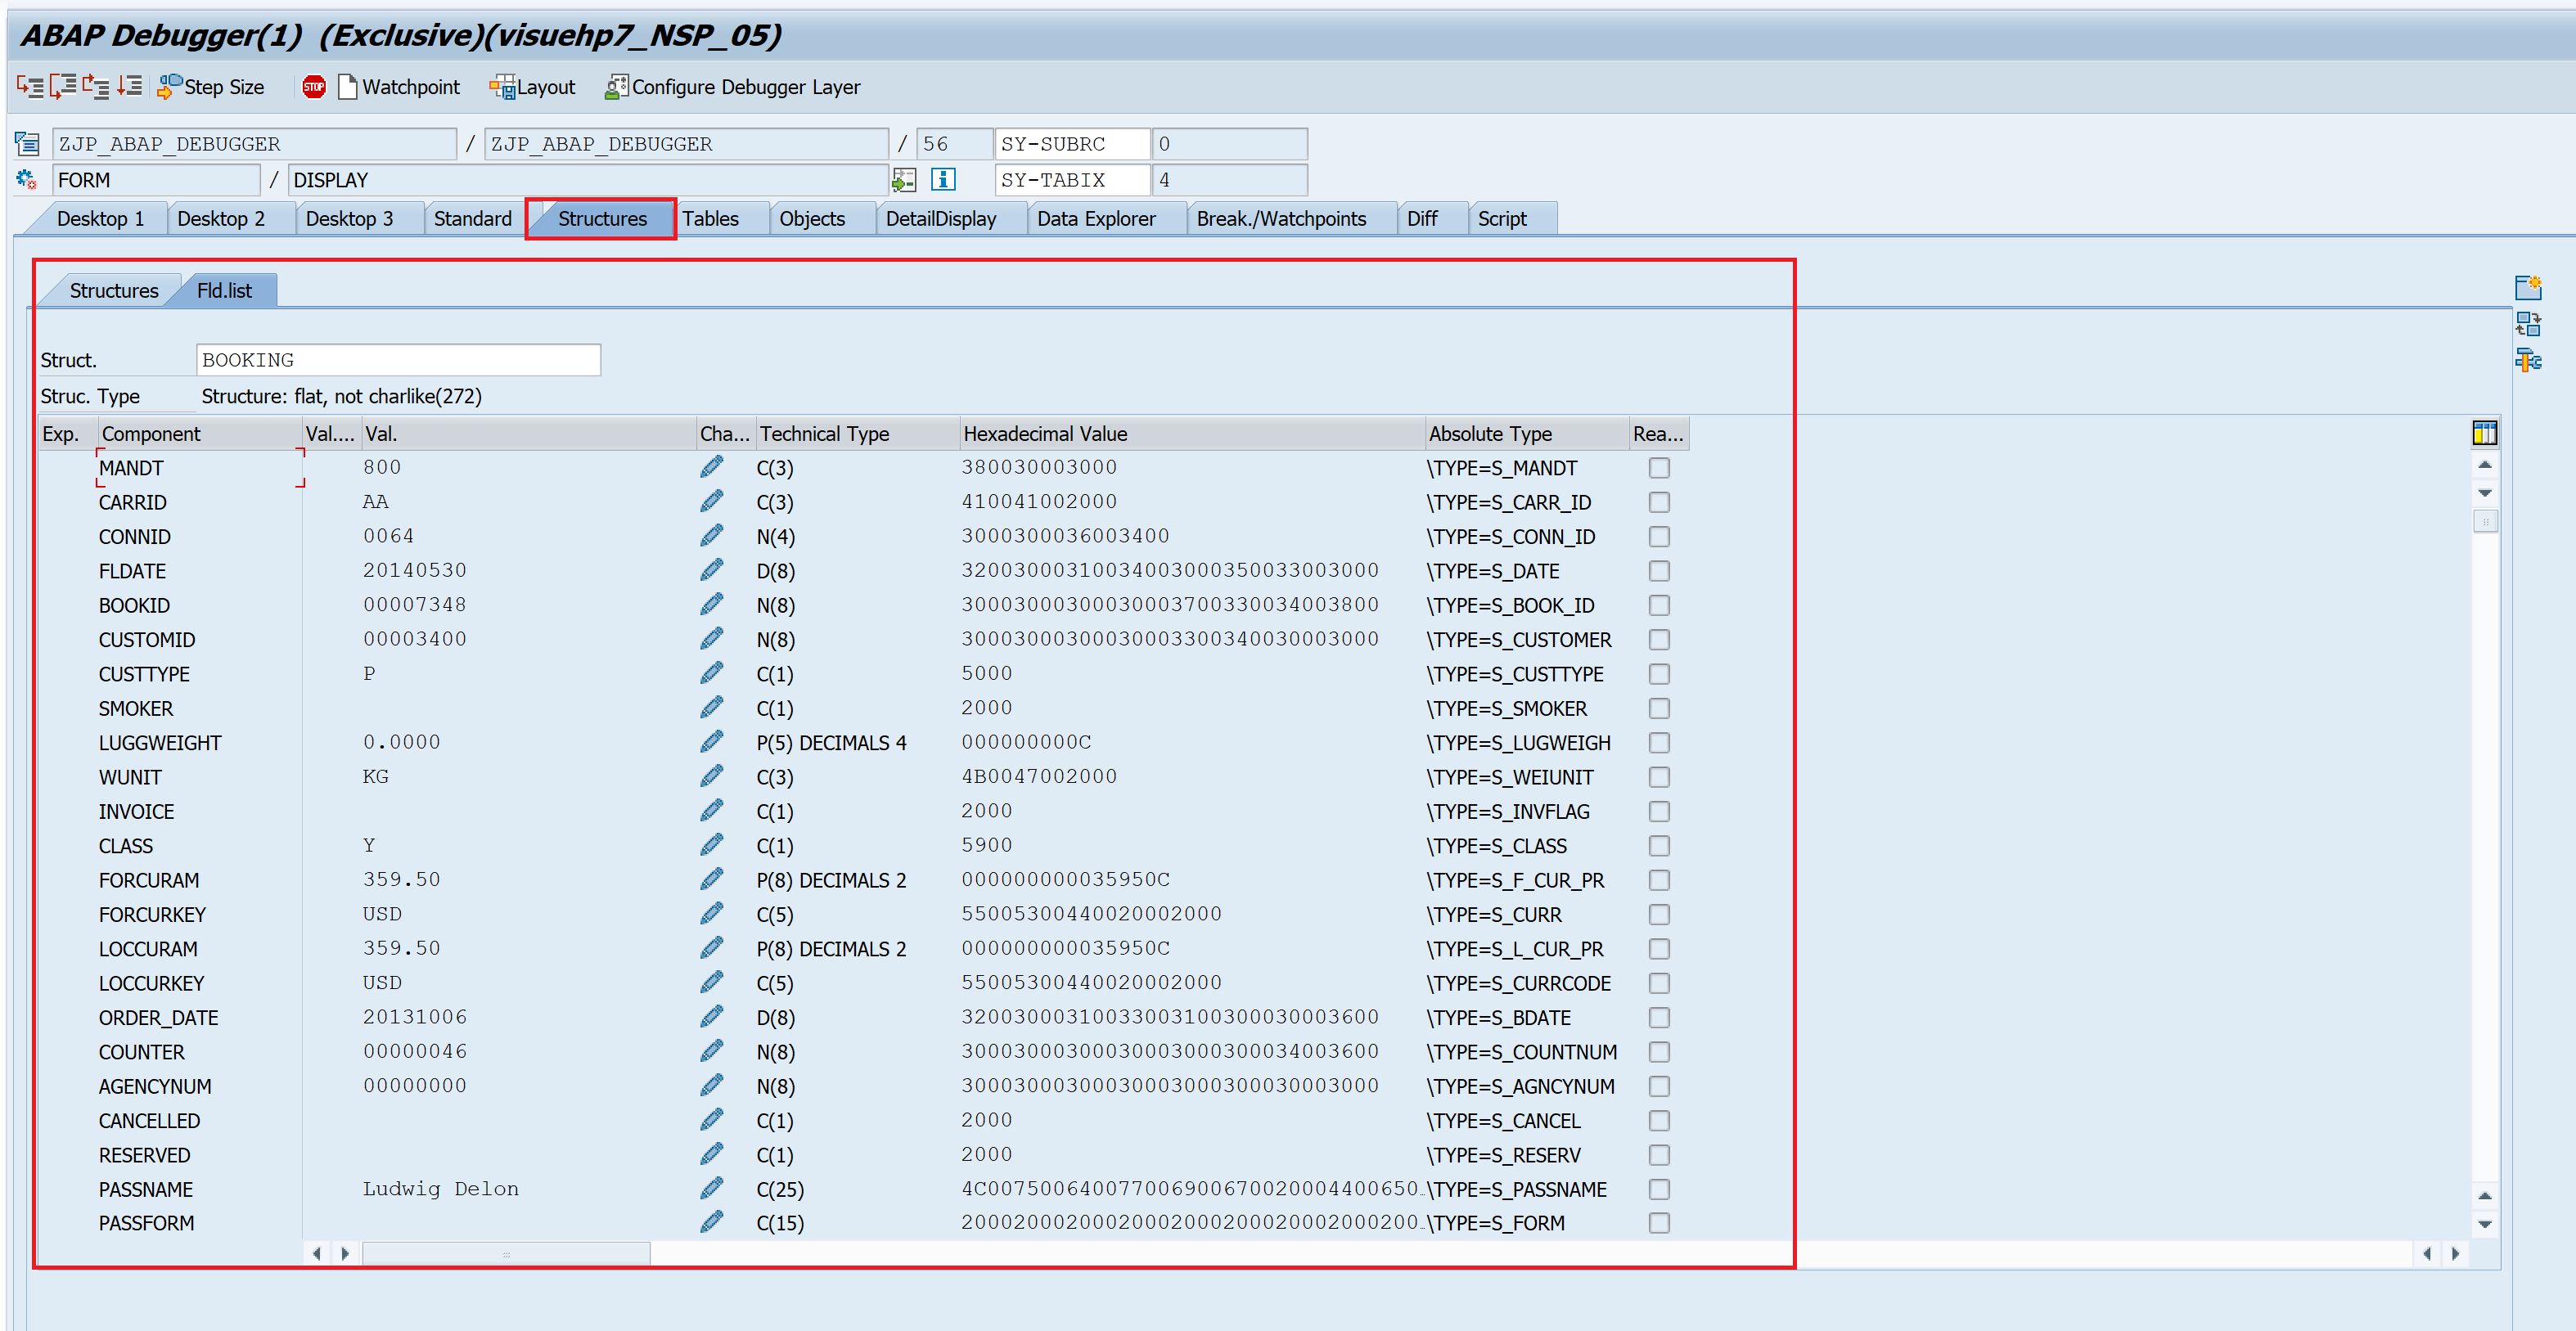
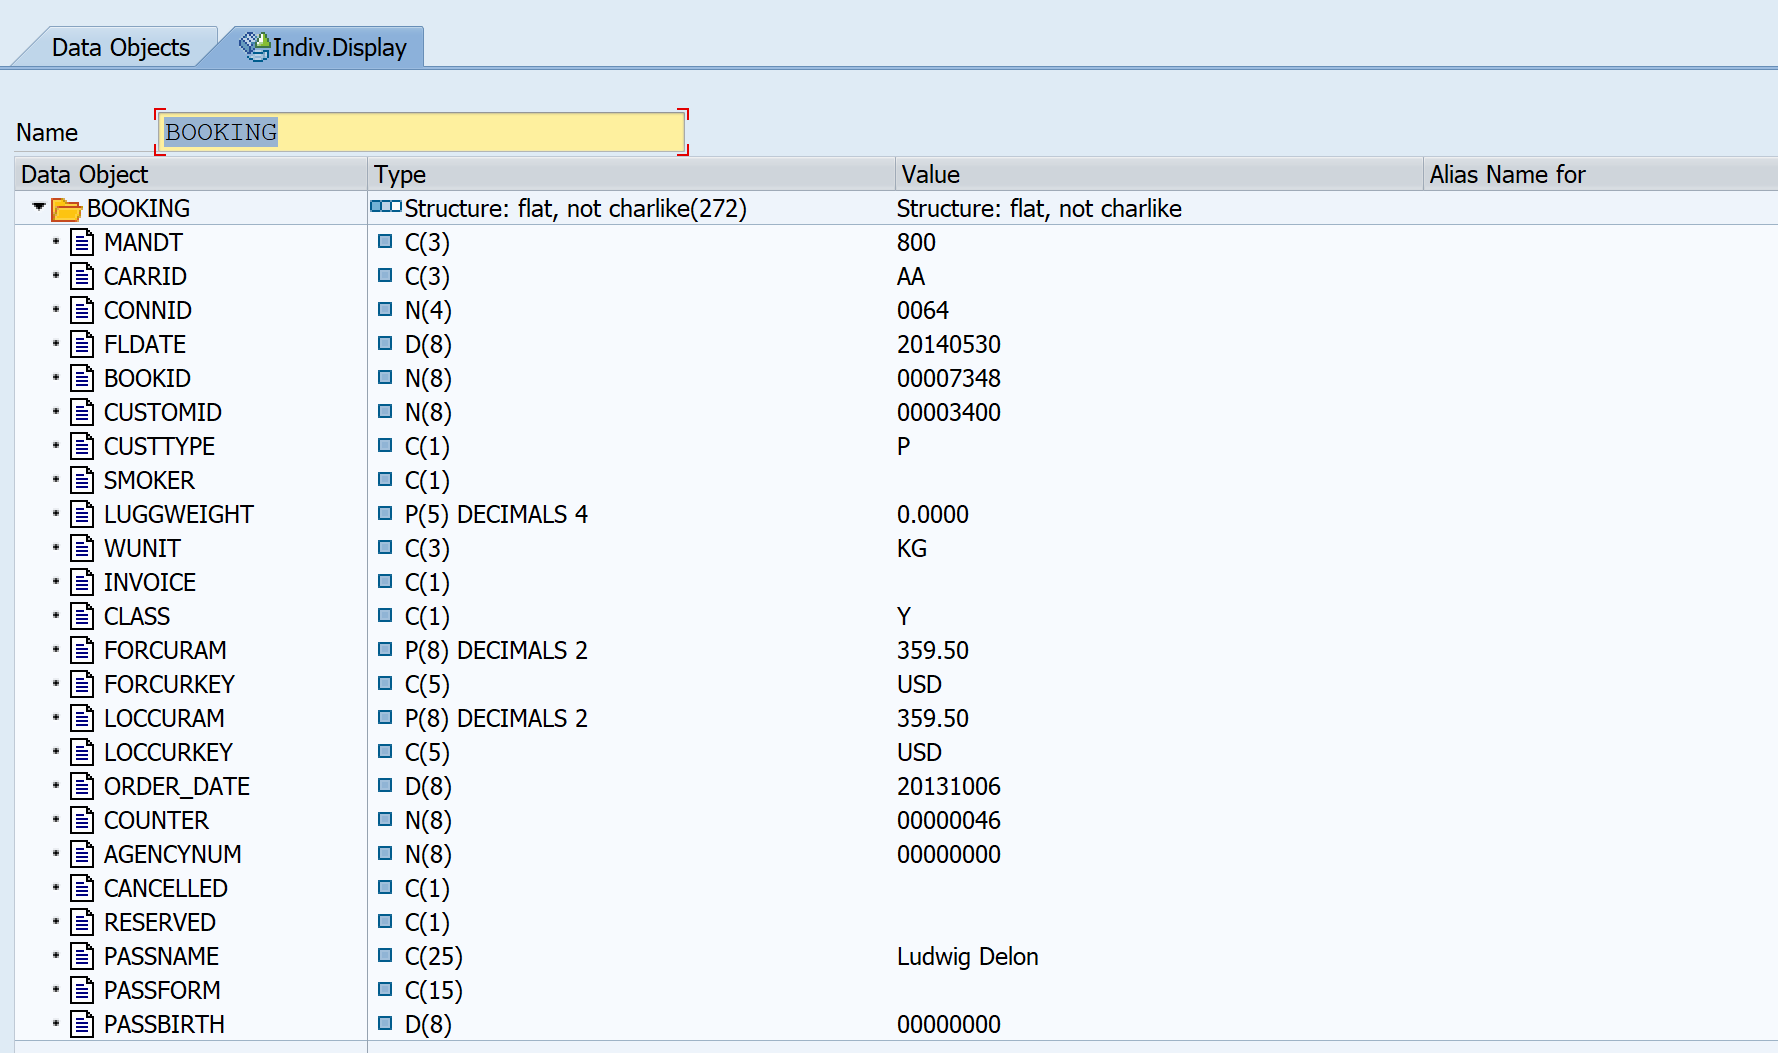
| Structure / Work area | BOOKING | Actual data is displayed in Structure view after double clicking on the name. |
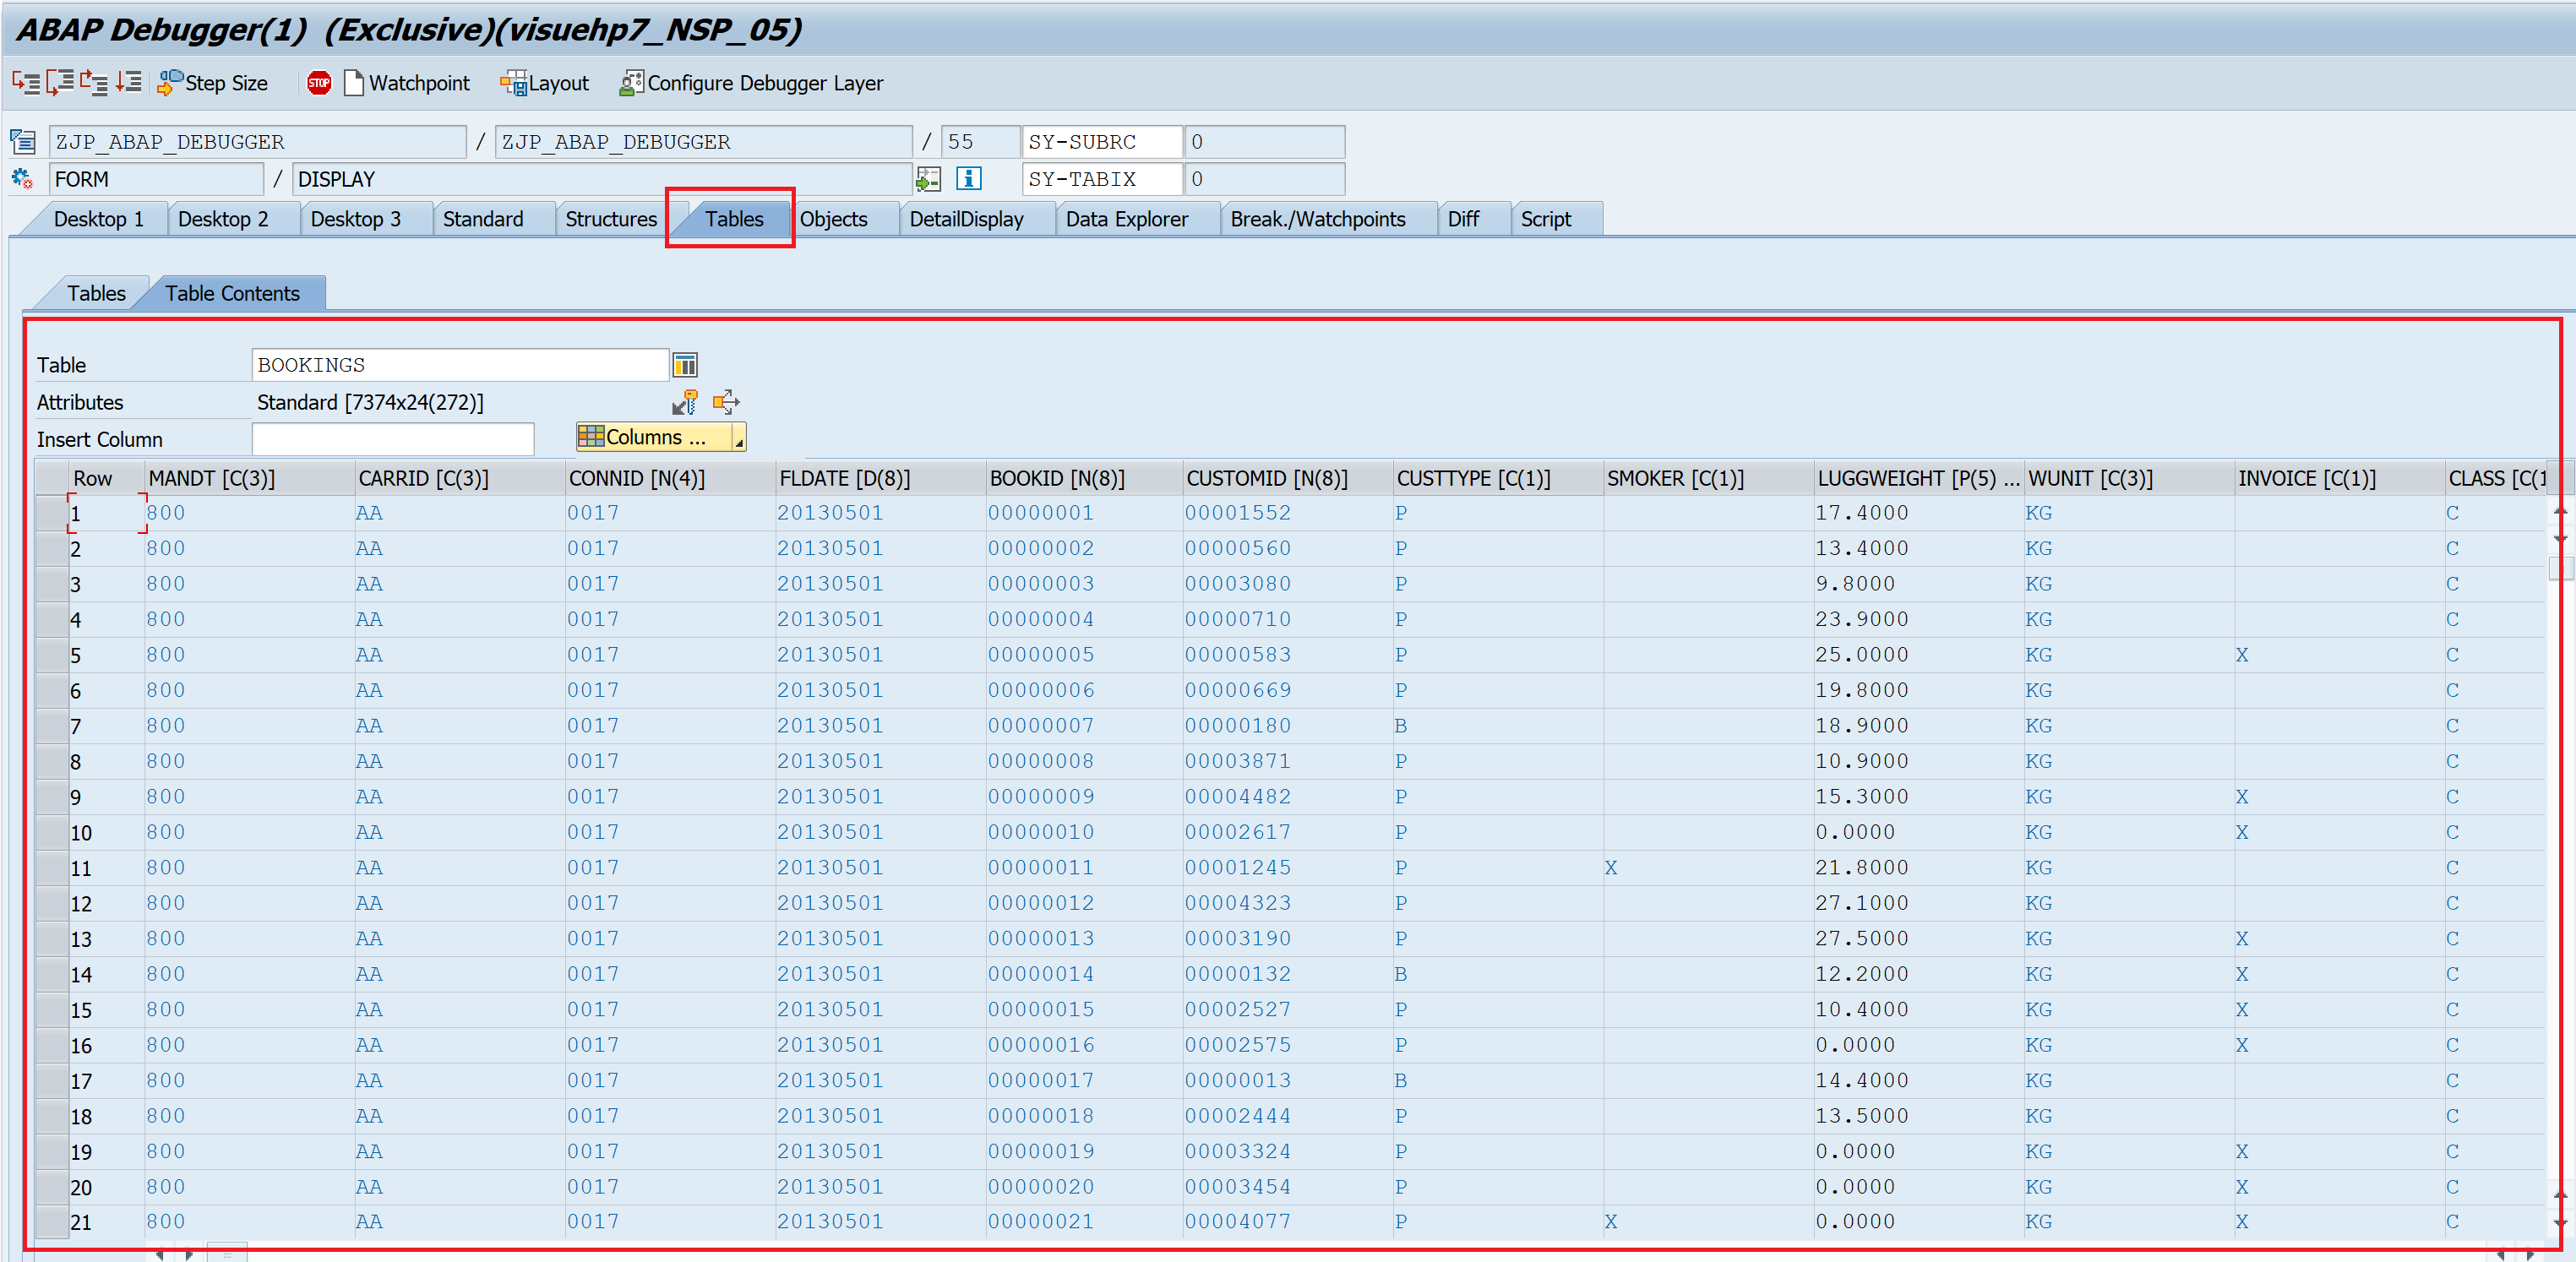
| Internal Table | BOOKINGS | Shows number of rows and columns. Actual data is displayed in Tables view after double clicking on the name. |
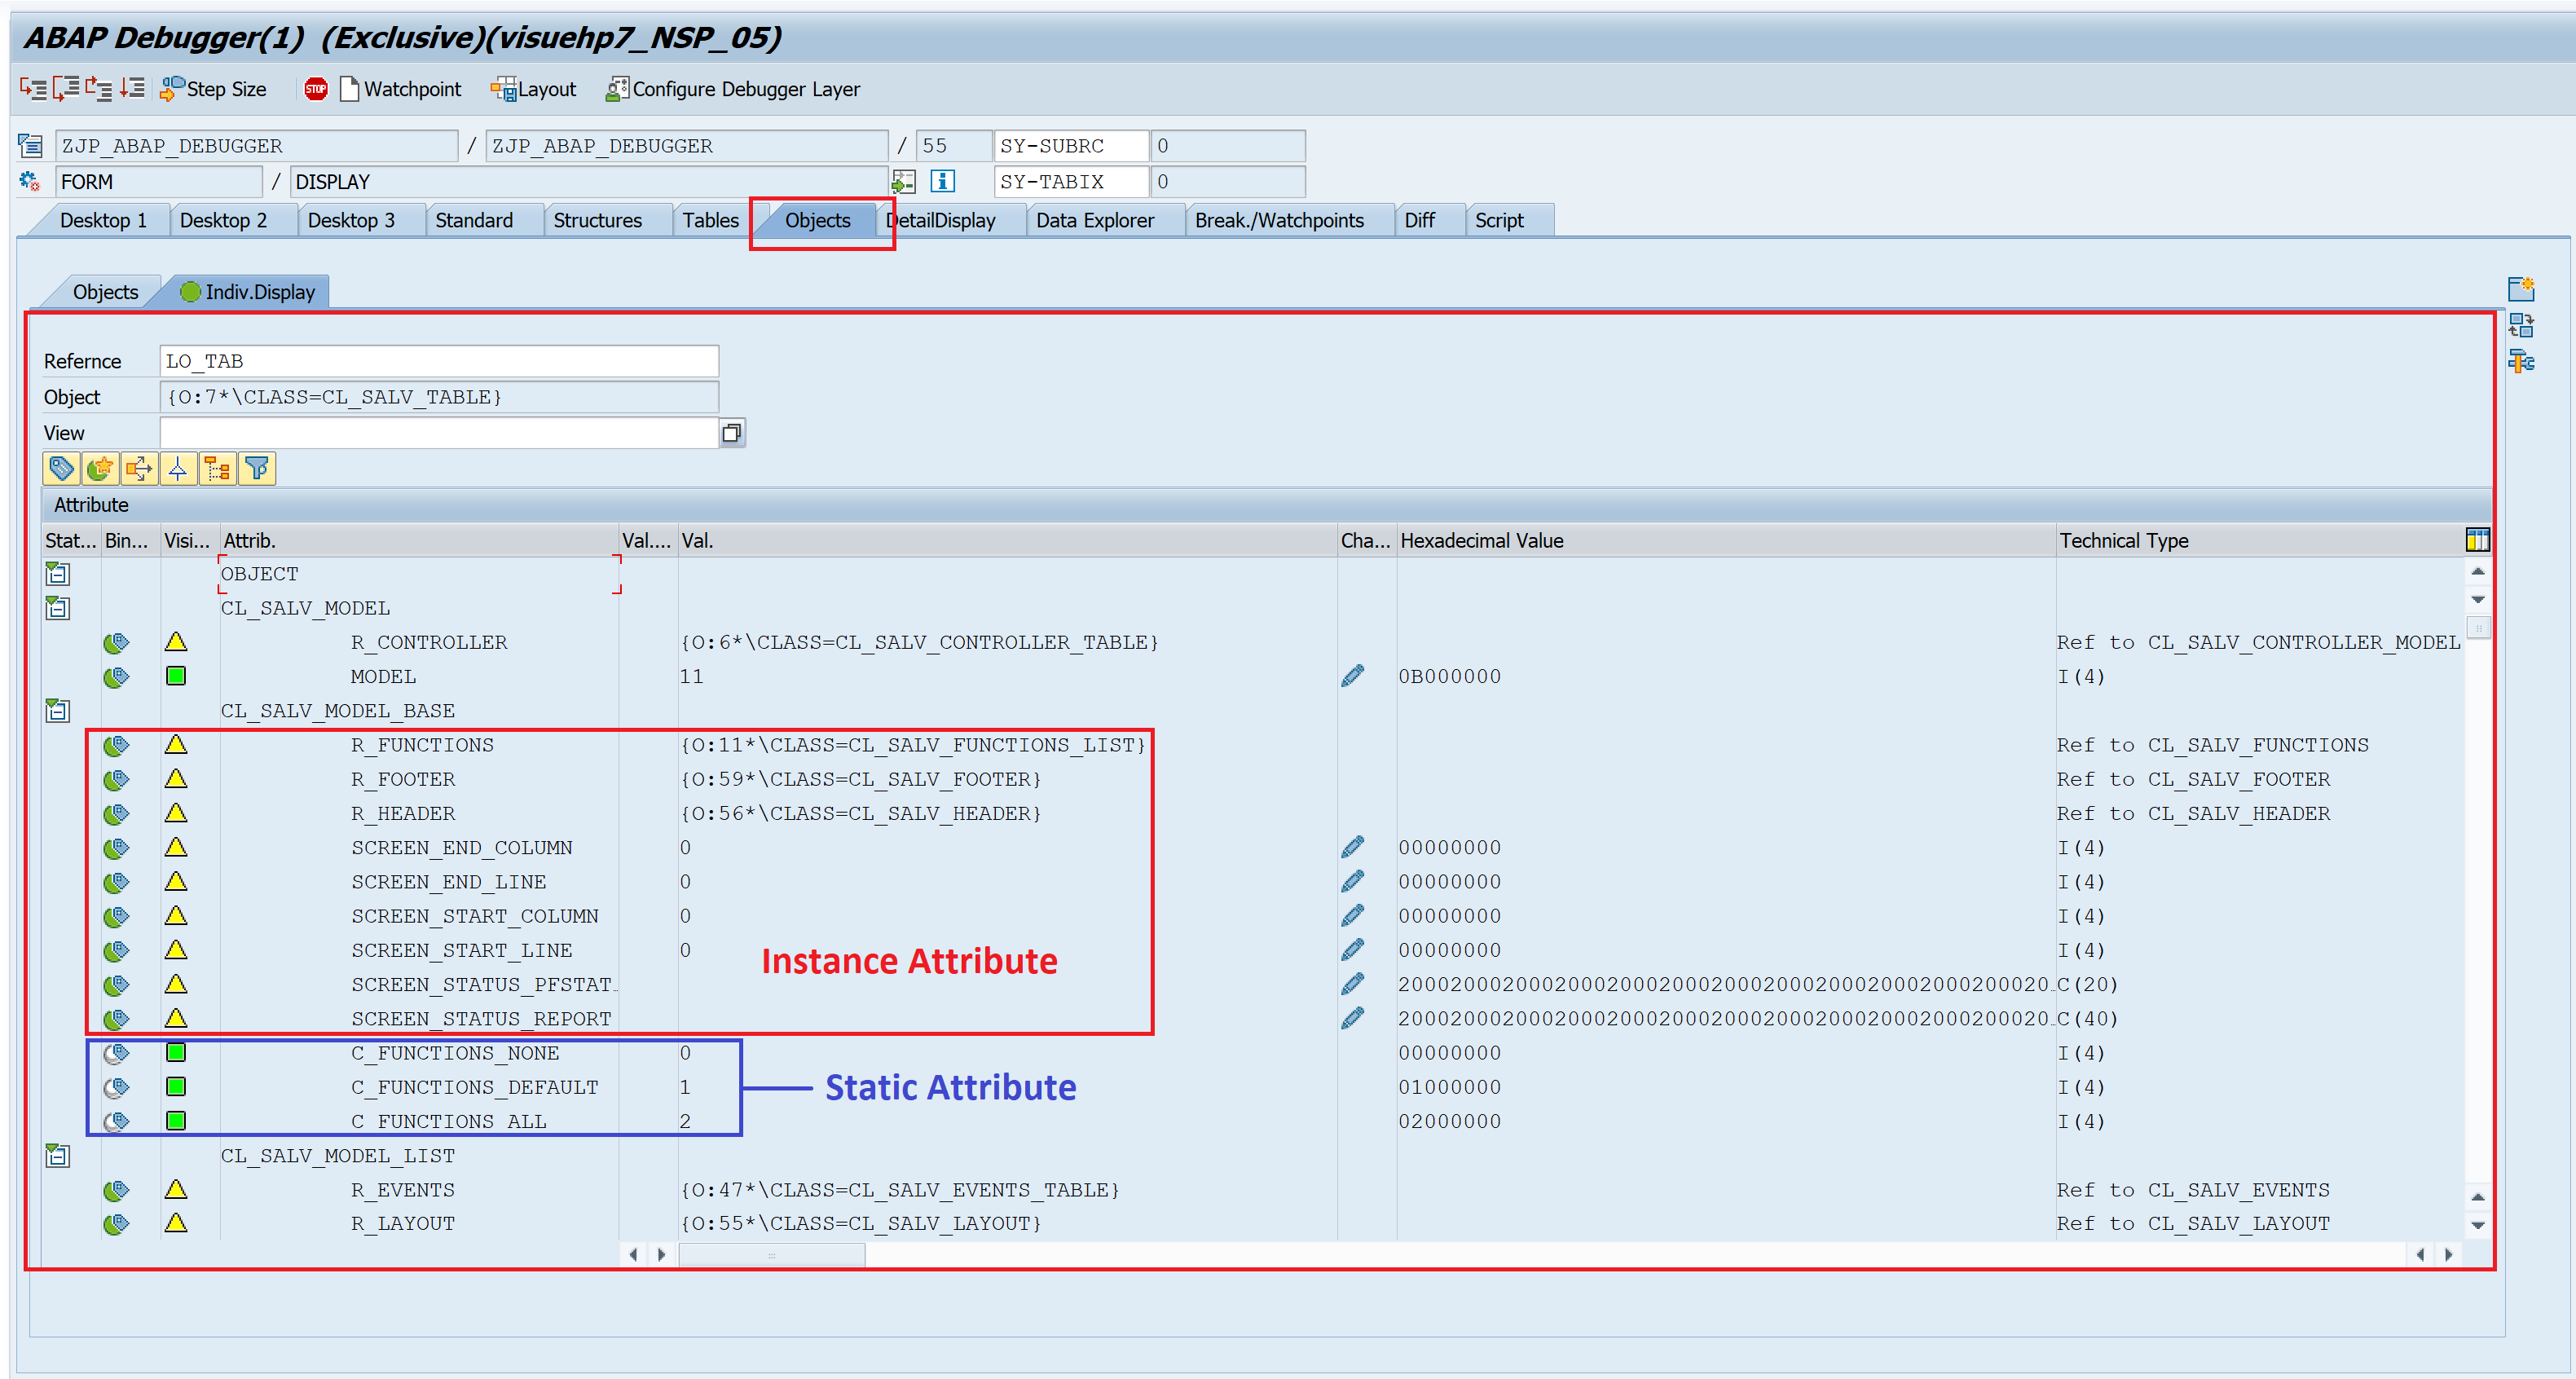
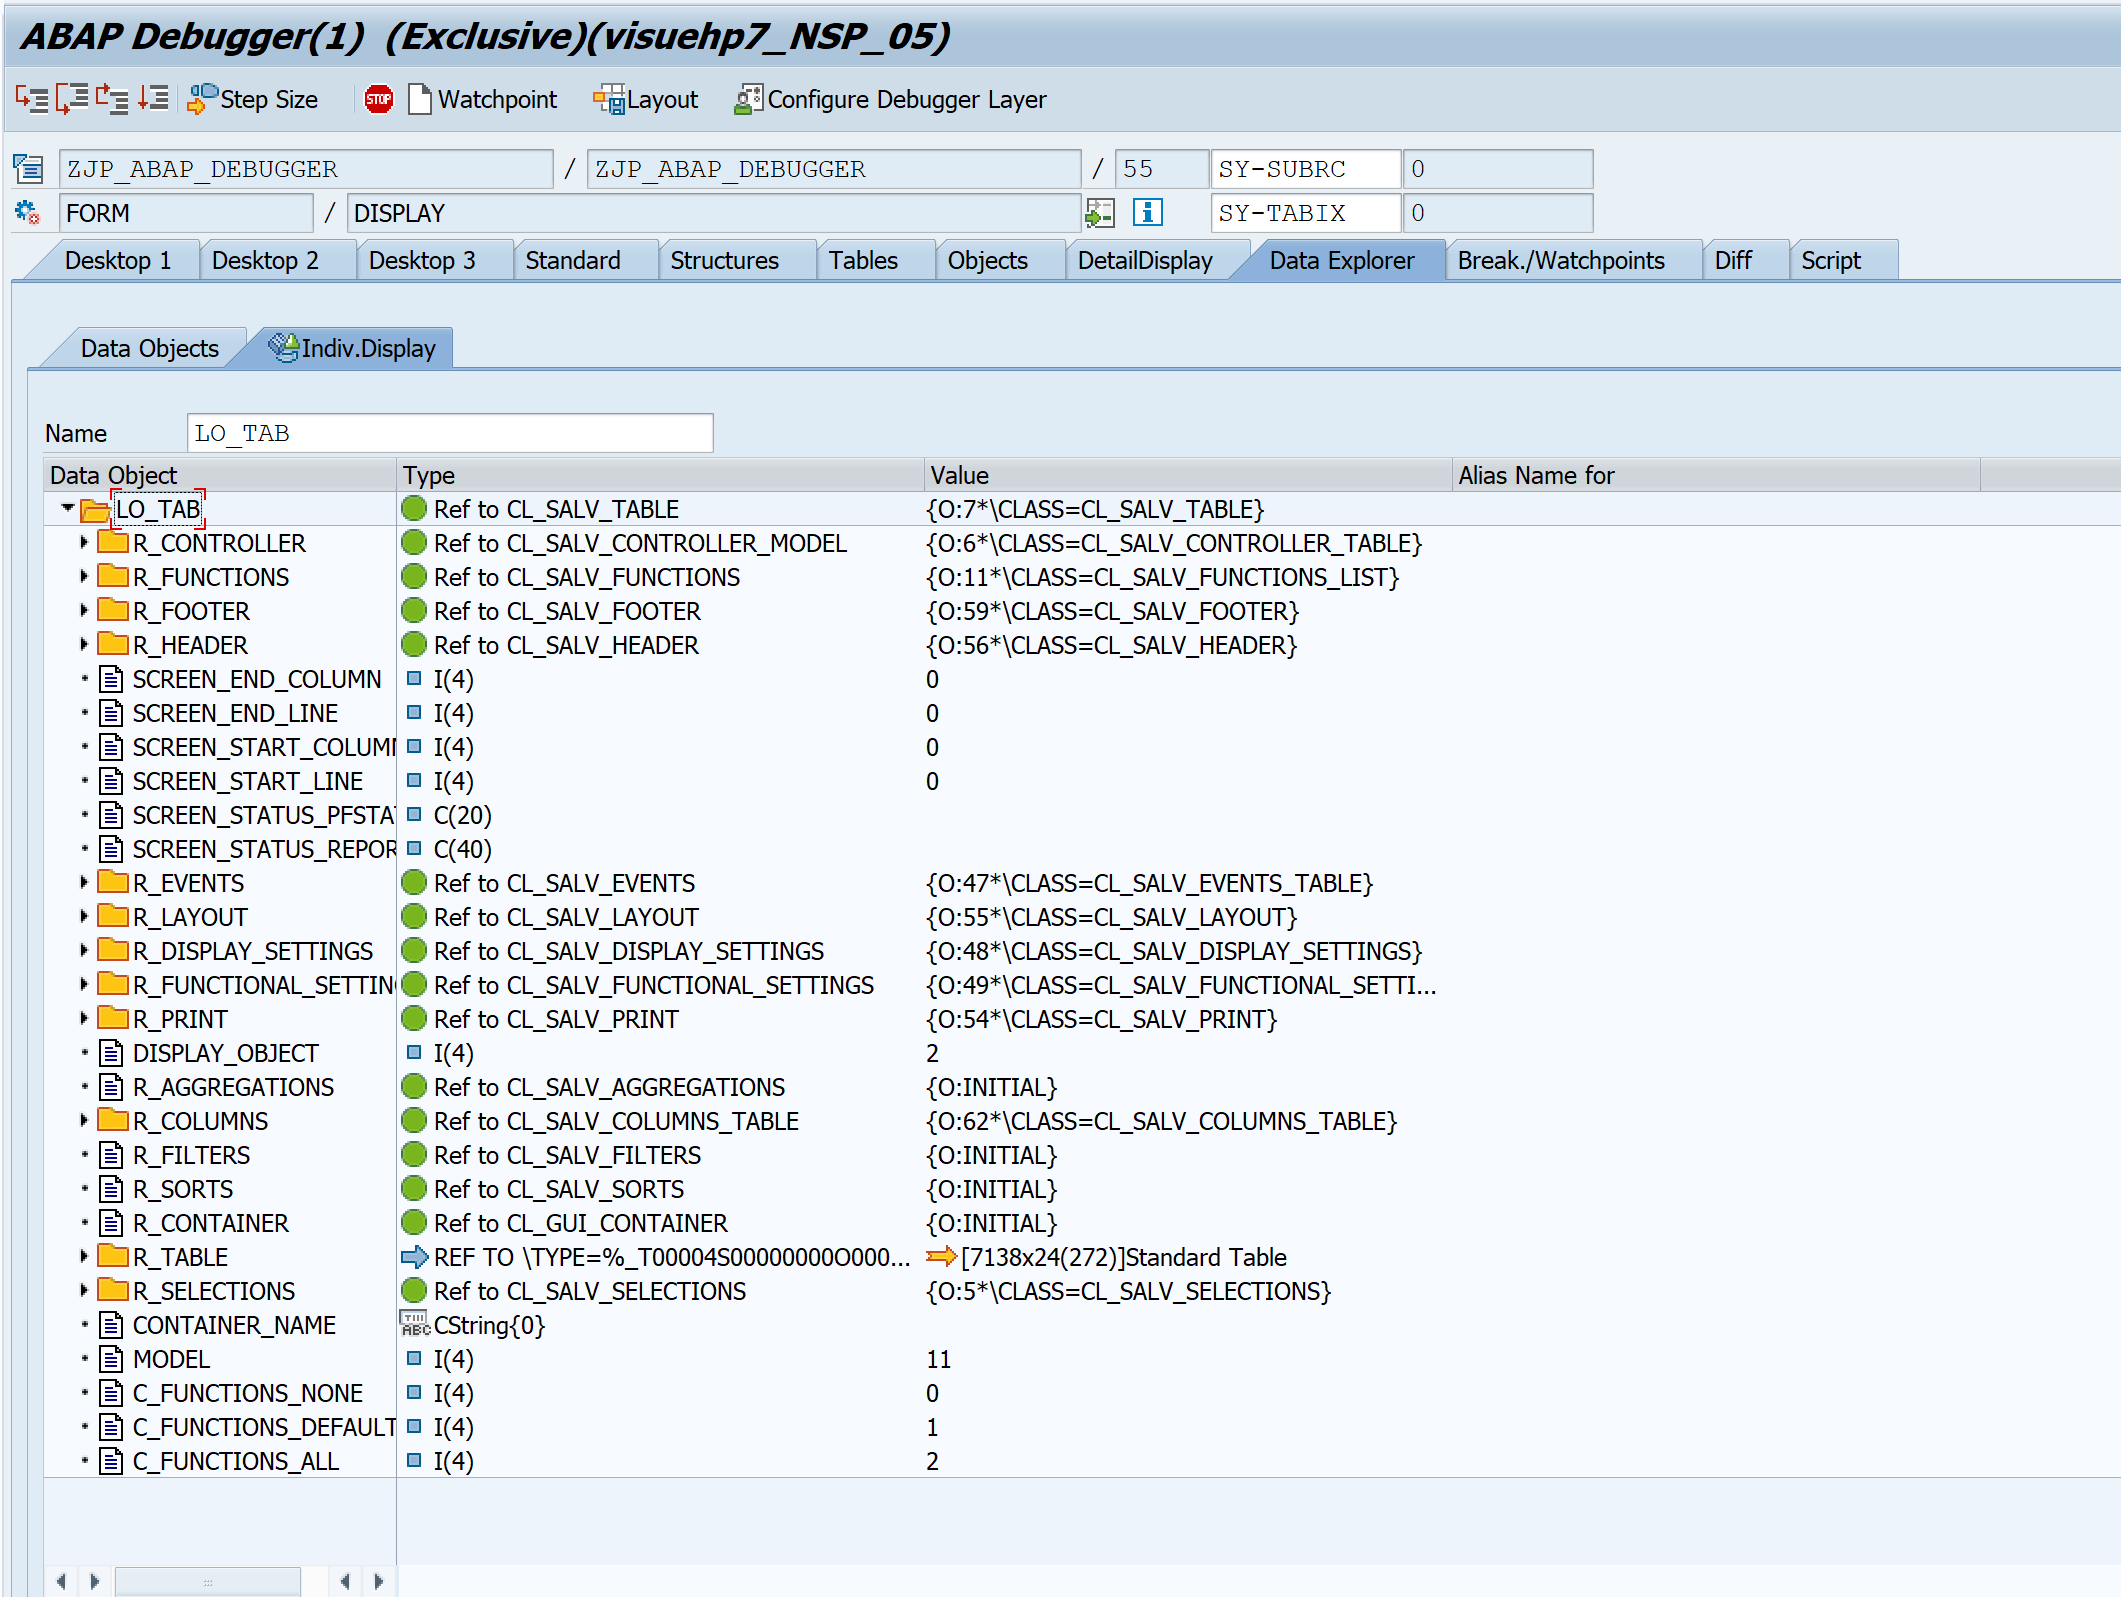
| Object | LO_TAB | Shows the object/class details. Actual data is displayed in Objects view after double clicking on the name. |
Structure view
Once you double click on a structure in variable section above or enter the structure name directly in the Structure View the structure components are displayed.
Tables view
This view shows the table content.
Objects view
Objects can be observed in object view. The object is created from a class reference – all the class attributes are shown. This does not show the methods though.
More information about variables
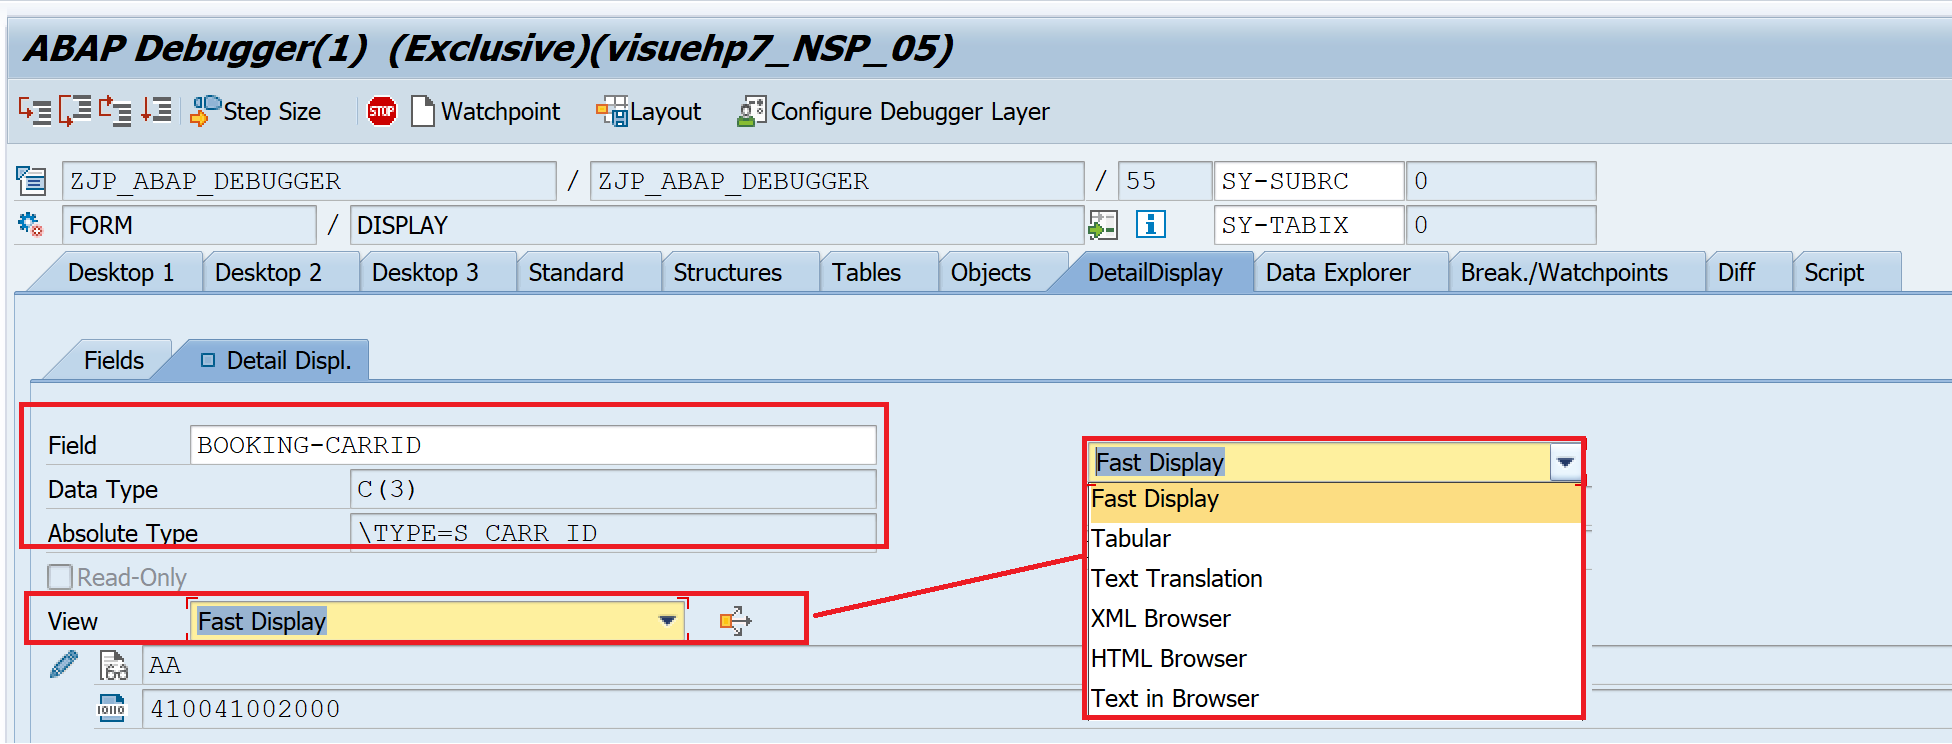
Detail Display
Details display shows the value of the variable along with its types. Also the View has various options. If the variable content is XML or HTML, this is useful.
Data Explorer
This view can show any type of data.
This tab is rarely used as other tabs already cover this function.
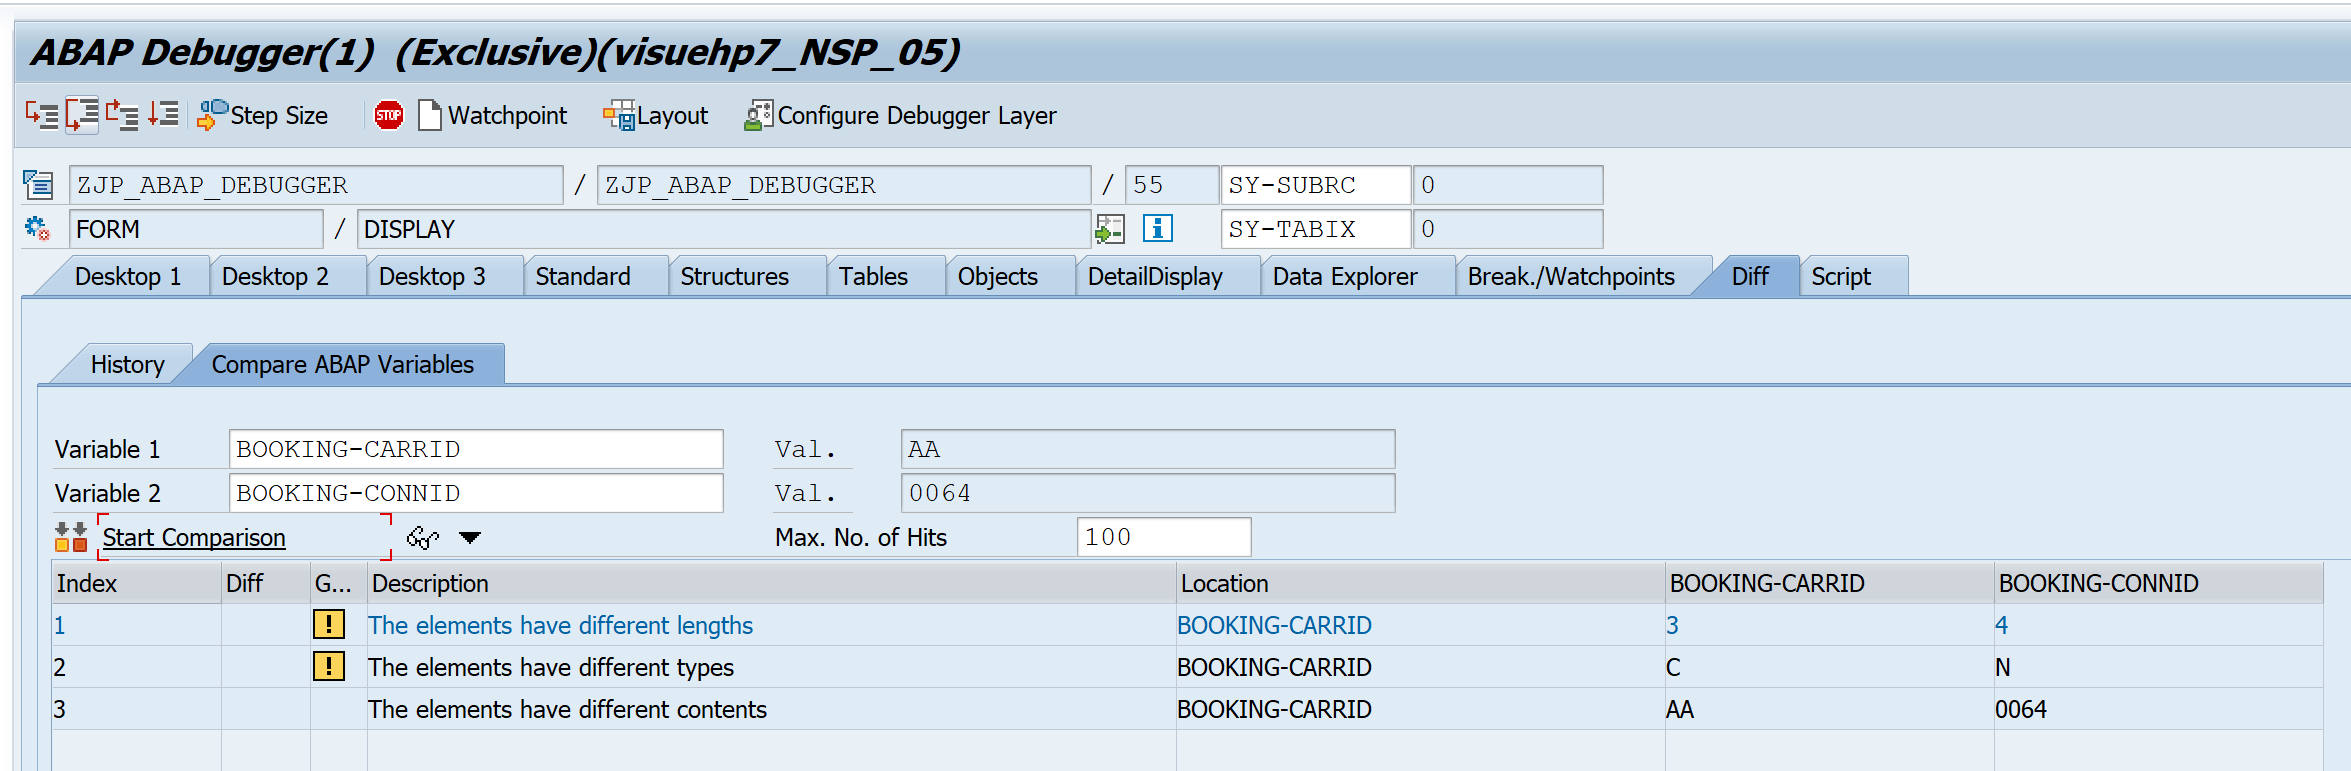
Diff
This view shows difference in two variables. Enter two variables and click on Start Comparison to get result similar to below.
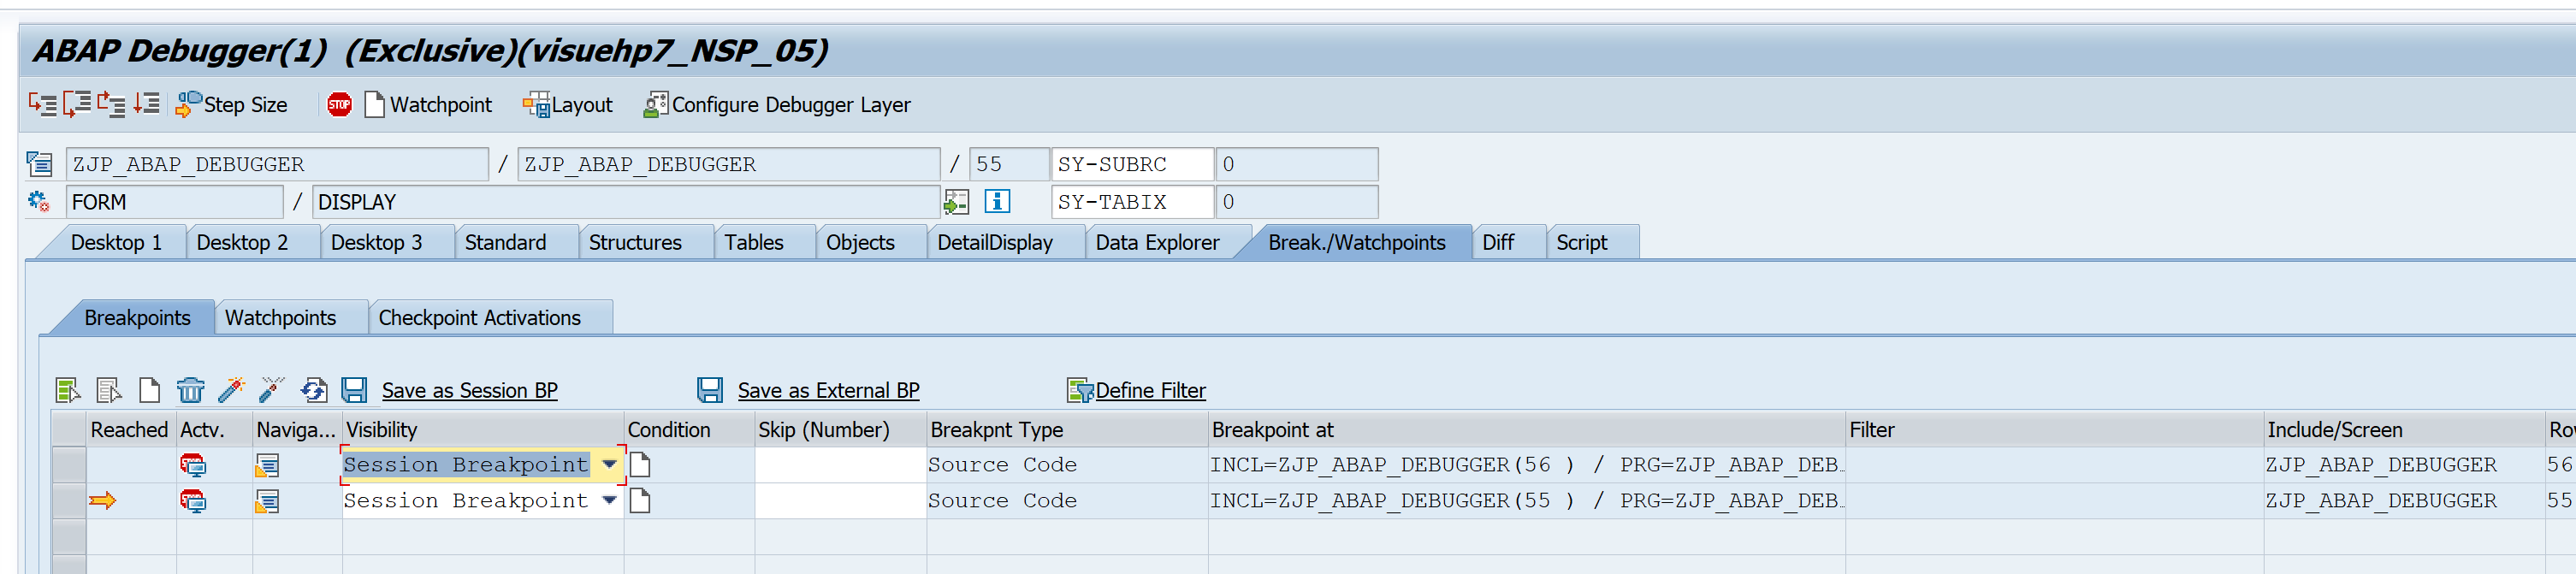
Break./Watchpoints
This tab will be discussed separately in more details later. However, this is how it looks. It shows all the breakpoints and watchpoints as the name suggests.
Script
Another tab that will have a dedicated post. This is not required at beginner level.
This is the overview off all the views, in the next post, we will start with the actual debugging.
Visit ABAP Debugger page to see more articles on debugging.
If you like the content, please subscribe…
